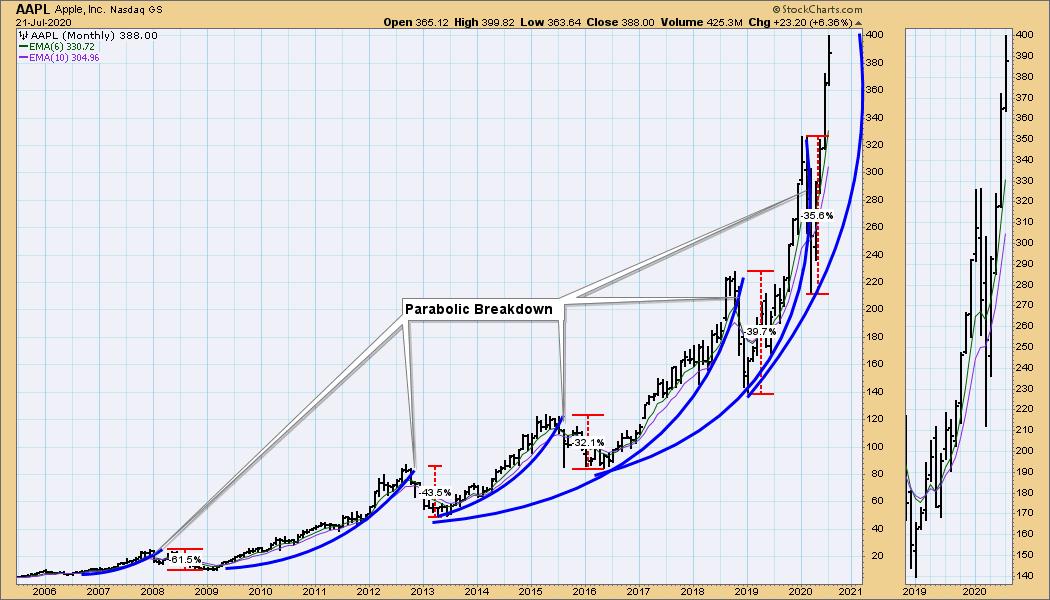
Apple (AAPL) has a history of sharp, parabolic price advances, followed by vertical collapses. Normal spacing between the tops runs from about two to four years, but recent periodicity has become compressed. The top in early 2020 arrived only about 15 months after the 2018 top, and it appears to me that the next top will arrive a lot sooner than that.
Parabolic advances are caused by buying frenzies that ultimately exhaust themselves and result in selling panics that correct the excesses. Since the March low, AAPL has advanced so quickly (+88%) it can't even touch the parabolic arc -- the upward path is nearly vertical. This is really dangerous, because it is highly unlikely that it can be sustained. How long it will last and how high it will go are questions that only a crystal ball can answer; however, the steepness of the advance should serve as a strong warning that the coming reversal is likely to be fast and furious, with a potential downside of -40% or more. It's not like it has never happened before.


As investors we want to accomplish two basic things: (1) Determine the trend and condition of the market, and (2) select stocks that will ride that tide. The DecisionPoint Alert helps with the first step, and DecisionPoint Diamonds helps with the second. Go to DecisionPoint.com and SUBSCRIBE TODAY!
Technical Analysis is a windsock, not a crystal ball.
Disclaimer: This blog is for educational purposes only and should not be construed as financial advice. The ideas and strategies should never be used without first assessing your own personal and financial situation, or without consulting a financial professional. Any opinions expressed herein are solely those of the author, and do not in any way represent the views or opinions of any other person or entity.
Helpful DecisionPoint Links:
DecisionPoint Alert Chart List
DecisionPoint Golden Cross/Silver Cross Index Chart List
DecisionPoint Sector Chart List
Price Momentum Oscillator (PMO)
Swenlin Trading Oscillators (STO-B and STO-V)
