 The Financial sector has been picking up a lot of relative strength recently.
On the Relative Rotation Graph for US sectors (against SPY), XLF is on a rotation trail through the improving quadrant and closing in on a cross over into the leading quadrant. Where JdK RS-Momentum was slightly lower to flat since mid-September, the RRG-Heading is now moving into the desired 0-90 degrees again and now looks ready to move into leading any time soon.
As it has been a while since I discussed the members of the Dow Jones Industrials index through the RRG-Lens, I figured that today would be a good symbolic day to do that, with $INDU hitting 30k.
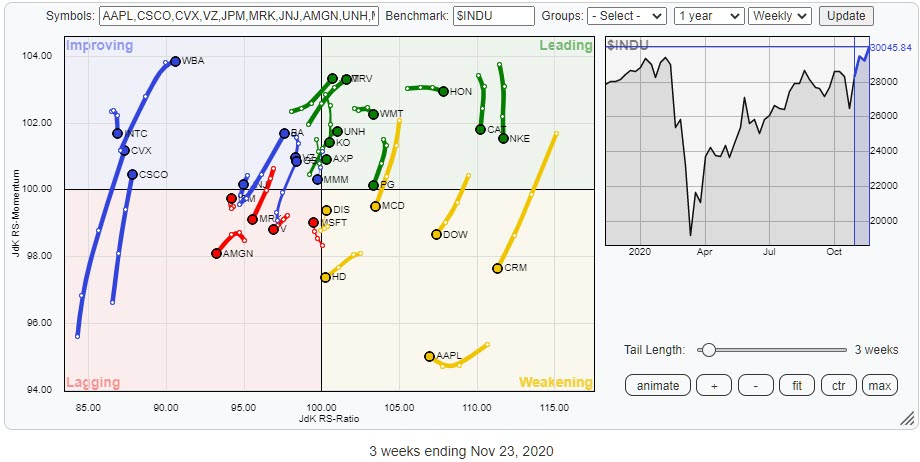
The RRG above shows the rotation for all 30 members of the DJ Industrials index. In this universe are four financial stocks: AXP, JPM, GS and TRV.

On the zoomed-in RRG above, you can see that all four stocks are rotating at n RRG-Heading between 0-90 degrees. AXP just returned back to that positive heading. Three are already inside the leading quadrant; GS is picking up the pace rapidly while inside the improving quadrant.
GS

The upward break out of the range on the price chart initiated the bounce of relative strength of its support. The RRG-Lines are now picking up on this improvement, and, with the JdK RS-Momentum line above 100, they are positioning the GS-tail inside the improving quadrant. As both are rising, the heading is between 0-90 degrees.
There are still a few hurdles on the way in the form of some overhead resistance levels on both the price and the relative charts, but things are starting to look better for GS.
AXP

The RS-Momentum line started to improve already in May/June of this year. However, only recently was the momentum strong enough to drag RS-Ratio above 100 as well.
The relative strength line bounced off a solid support level that has been tested multiple times this year. The recent rise of RS above its recent peak is the first sign of further improvement.
On the price chart, the upside is free towards the $135 area, where the early 2020 peaks are located. The turn of the tail back to 0-90 degrees suggests that an upward break in RS is imminent, which will push AXP further ahead into the leading quadrant.
JPM

The turnaround in relative strength for JPM is nicely visible in the raw RS-Lines. The RRG-Lines picked up this improvement and are now both above 100 and moving higher, positioning the tail for JPM inside the leading quadrant and at a strong RRG-Heading.
The gap higher three weeks ago is still holding up and, as a matter of fact, JPM is also holding up above the former resistance coming from the $112.50 peak in June.
All in all, this is a strong chart with more upside potential available in both price and relative terms.
TRV

TRV moved strongly higher over the last few weeks and managed to clear a few important hurdles on the price chart. At the moment, TRV is facing overhead resistance in the $140 area. With relative strength stalling just below its horizontal resistance, I think we now need to see a push above that $140 barrier in price in order for the trend to continue.
The downside is protected by support in the gap area around $130, which concurs with an important horizontal level that should act as support now.
Price action in the coming days/weeks will provide more guidance. A break above $140 is certainly considered to be a bullish event.
#StaySafe, --Julius
Julius de Kempenaer
Senior Technical Analyst, StockCharts.com
Creator, Relative Rotation Graphs
Founder, RRG Research
Host of: Sector Spotlight
Please find my handles for social media channels under the Bio below.
Feedback, comments or questions are welcome at Juliusdk@stockcharts.com. I cannot promise to respond to each and every message, but I will certainly read them and, where reasonably possible, use the feedback and comments or answer questions.
To discuss RRG with me on S.C.A.N., tag me using the handle Julius_RRG.
RRG, Relative Rotation Graphs, JdK RS-Ratio, and JdK RS-Momentum are registered trademarks of RRG Research.
