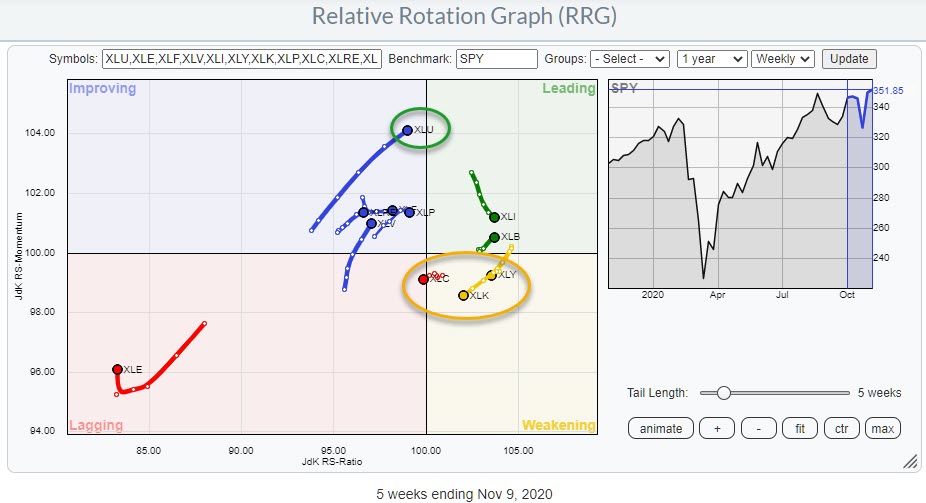
The Relative Rotation Graph for US sectors shows an ongoing rotation out of the three strongest performers in 2020 so far.
Technology is inside the weakening quadrant, following a long rotation through leading, and has started to accelerate towards lagging. Consumer Discretionary is trailing slightly behind the rotation of XLK and is also heading towards lagging.
Communication Services has just crossed over into lagging, albeit on a short tail and with only two days of trading done for the week. But, so far, the direction is clear.
On the positive side, we see a very strong tail on the Utilities sector, as well as Materials, inside leading. Industrials has been losing some relative momentum over the last few weeks, but still managed to move slightly higher on the RS-Ratio scale and remain inside the leading quadrant.
Daily Rotations
In order to put these weekly rotations into perspective and see if we can find confirmation for these moves, I want to look at the daily rotations.
The RRG below holds the tails for the six sectors mentioned above.

Technology

Tech continues to lose relative strength vis-à-vis the market and other sectors. The RS-line peaked in August and has been moving flat since then. This caused the JdK RS-Momentum line to roll over and cross below 100 already a while ago, but that move is now accelerating and dragging JdK RS-Ratio down with it. On the RRG, this positions XLK inside the weakening quadrant, heading towards lagging.
The tail for XLK on the daily RRG is positioned inside the lagging quadrant and it started to bend left, further into lagging again, after a few days of picking up relative momentum. Although it is still possible for XLK to rotate back towards leading on the weekly RRG, the weakness on the daily chart is starting to make this more questionable.
On the price chart, pretty well-defined resistance is now building up around $125, with support around $110.
Consumer Discretionary

Consumer Discretionary tried to break higher on the price chart at the start of this week, but rapidly dropped back below resistance in the $155 area.
This is the third time that XLY has been stalling in that region, which is taking its toll on relative strength. The RS-Line broke a steep rising support line and seems to be putting a top into place, while RS-Momentum has dropped below 1oo and is now dragging RS-Ratio lower. Just like XLK, this positions XLY inside the weakening quadrant and heading towards lagging.
A check on the tail for XLY on the daily RRG reveals an accelerating move into the lagging quadrant, which means that more relative weakness lies ahead, at least, in the near term. This similar direction of travel on both the weekly and the daily RRGs makes a turn back up for XLY inside the weakening quadrant (weekly RRG) more and more questionable.
Communication Services

After breaking out of a trading range on the relative strength chart, XLC has not been able to accelerate materially higher. As a matter of fact, a new trading range has developed, with the top of the former range now acting as support.
As a result, the RRG-Lines rolled over, with the JdK RS-Momentum line crossing below 100 already in July and the RS-Ratio line now following momentum lower, causing the sector to cross over into lagging quadrant on the weekly RRG. With the daily tail moving rapidly lower on the RS-Momentum scale and starting to move lower on the RS-Ratio scale as well, more relative weakness is expected ahead.
In terms of price, XLC tested resistance at the level of the previous high, but, so far, without success. That means that the area around $64 will become more important as a resistance level while support is marked at $57.
Utilities

Utilities jumped out of the triangle formation that characterized the sector since April and rapidly accelerated higher after that break.
From a relative point of view, things were not looking very strong after the downward break out of the sideways range in the RS-line. But, recently, that image has been starting to shift. RS is now returning back into the range after initially breaking lower. This very often leads to a relative rally towards the top of that range,
The RRG-Lines are rapidly improving on the back of the RS-improvement, and it only seems a matter of time before XLU crosses over into the leading quadrant from improving.
On the daily RRG, the XLU tail is now rotating through weakening after a strong move through leading. Measured on the RS-Ratio scale, XLUY is still one of the top sectors in terms of relative strength and has the ability to turn back up towards leading without hitting the lagging quadrant. Such a rotation on the daily RRG will reinforce the strength of the rotation on the weekly RRG going forward.
Industrials

Industrials actually broke to new highs on the price chart and has, so far, been able to hold up above its breakout level. Combine that with the break from a bottom formation in relative strength and things look good for Industrials.
The sector is, so far this month, tracking the expected seasonal outperformance over SPY, beating the index by 2.3% as of today. A look at the daily tail for XLI confirms the current strength with a rapid acceleration straight into the leading quadrant.
Materials

Materials could very well be the strongest sector in the US at the moment. XLB already broke to new highs last week (before the elections) and jumped higher this week. That strong upward move is confirming the strength in relative strength that started to appear late August, when the RS-Line broke above horizontal resistance, former support. At that time, the RRG-Lines had already positioned the tail inside the leading quadrant.
After a short pause in RS after the break, momentum is now picking up again and is expected to push the sector further into the leading quadrant, with both the daily and the weekly tail traveling at a positive RRG-heading. Just like Industrials, XLB is tracking the expected seasonal outperformance vs. SPY, outperforming the index by 1.5% so far this month.
The current rotational paths suggest a further rotation out of XLK, XLC and XLY and into XLU, XLI and XLB.
#StaySafe, --Julius
Julius de Kempenaer
Senior Technical Analyst, StockCharts.com
Creator, Relative Rotation Graphs
Founder, RRG Research
Host of: Sector Spotlight
Please find my handles for social media channels under the Bio below.
Feedback, comments or questions are welcome at Juliusdk@stockcharts.com. I cannot promise to respond to each and every message, but I will certainly read them and, where reasonably possible, use the feedback and comments or answer questions.
To discuss RRG with me on S.C.A.N., tag me using the handle Julius_RRG.
RRG, Relative Rotation Graphs, JdK RS-Ratio, and JdK RS-Momentum are registered trademarks of RRG Research.
