The Equal Weight version of the Relative Rotation Graph for US sectors shows an interesting divergence in rotation for the Consumer Discretionary sector.
Two weeks ago, 3/2, I showed the RRG for small-cap sectors and analyzed the discrepancies between the small-cap and the large-cap sector rotations. Here also, the difference between Discretionary small-cap (PSCD) and Discretionary large-cap (XLY) stood out.
As a matter of fact, I added PSCD (on the long side) and XLY (on the short side) to the RRG Long/Short basket. This basket, by the way, is now one year old and continues to do well. The graph below shows the return since inception.

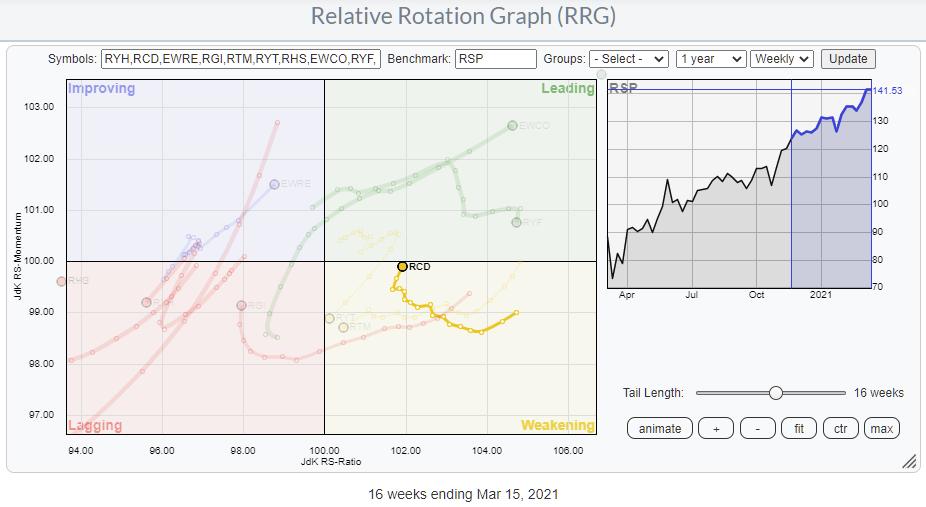
Going back to the Consumer Discretionary sector, the graph at the top shows the RRG for Equal Weight sectors versus RSP, the equal-weight version of SPY. The tail for RCD is highlighted as it is moving through weakening and now rotating back to (and almost into) the leading quadrant.
In order to better compare the tails and the rotations for Discretionary Large Cap, Discretionary Small Cap and Discretionary Equal Weight, I have put them all together in the RRG below, which uses SPY as the benchmark.

The different rotations of the tails, but also the different returns for the these three variants of the same sector, speak volumes IMHO.
There is no doubt that PSCD, the small-cap segment of this sector, is the best and still at a strong rotation. The equal weight sector (RCD) is now rotating back into the leading quadrant vs. SPY, which makes it an interesting play as this means it is about to start a new leg upward in the already rising trend.

The chart shows RCD on a weekly basis, with relative strength vs. SPY and the RRG-Lines.
The JdK RS-Momentum line picks up the improvement for RCD in May when it crosses above 100, putting RCD inside the improving quadrant at a positive RRG-heading. Because of how deep the JdK RS-Ratio line sunk (85 is low for sectors), it took until August before RCD crossed into the leading quadrant.
Once the initial improvement took RS-Ratio to around 105, things started to stabilize and both the RS-Ratio line, as well as the RS-Momentum line, moved almost horizontally with very little amplitude. Such a move causes the sector to remain almost static on the Relative Rotation Graph and show a very short tail; the characteristics of a very stable (up-)trend.
The two most recent dips of the RS-Momentum line below 100 caused the rotations from leading to weakening and back into leading. Another such rotation is now completing. This suggests that this (stable) relative uptrend is still in play and about to continue. From a price perspective, the chart looks a bit overstretched and we can see a small setback. But with the relative trend continuing as it is, such a setback looks like a buying opportunity.
With regard to individual stocks in the Consumer Discretionary space, the message is rather simple. Just avoid XLY, and Amazon (AMZN) and Tesla (TSLA) in particular, for the time being and focus on the stocks with smaller market capitalizations.
The RRG below shows all members of the Consumer Discretionary sector (XLY and RCD, not PSCD) and I have only enabled the tails for the stocks that are moving at a heading between 0-90 degrees. As you can see, there are quite a few that are worth further investigation. In the table below, you can see the ones that are missing from the graph (the unticked boxes).


#StaySafe, --Julius
Julius de Kempenaer
Senior Technical Analyst, StockCharts.com
Creator, Relative Rotation Graphs
Founder, RRG Research
Host of: Sector Spotlight
Please find my handles for social media channels under the Bio below.
Feedback, comments or questions are welcome at Juliusdk@stockcharts.com. I cannot promise to respond to each and every message, but I will certainly read them and, where reasonably possible, use the feedback and comments or answer questions.
To discuss RRG with me on S.C.A.N., tag me using the handle Julius_RRG.
RRG, Relative Rotation Graphs, JdK RS-Ratio, and JdK RS-Momentum are registered trademarks of RRG Research.
