Every last Tuesday of the month in Sector Spotlight, I review the seasonality for US sectors and try to match the historical performance with the current performance as it is playing out on the Relative Rotation Graph.
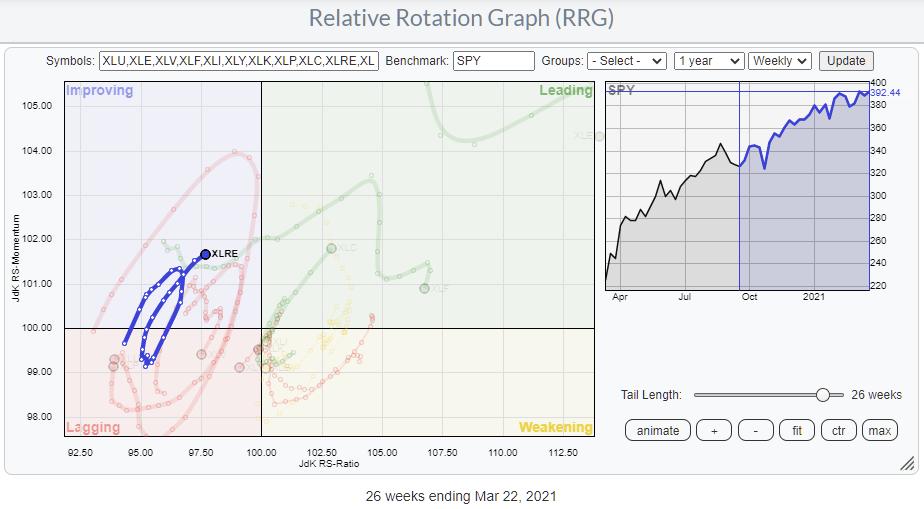
For March (see episode 68, "Seasonal Surprise for XLRE"), the Real Estate sector stood out as a potential surprise rotation. According to the seasonal pattern, March is usually a good month for Real Estate. On the RRG, the tail had just crossed back into the improving quadrant after a completed rotation lagging-improving-lagging, and then went back into improving again, as you can see on the RRG above.
Seasonality shows an outperformance over SPY in March 72% of the time, with an average outperformance of 2.7%. The combination of this expectation from seasonality and the strong rotation and RRG-Heading going into March made it an interesting sector to watch and play.
The "surprise" element came from the observation that Real Estate's seasonality in February and April is not that strong. Looking back now, we can see that this "surprise" is actually playing out pretty well so far. Since 2/22, the Real Estate Sector (XLRE) gained 5.4%, while SPY picked up 3.5%. So XLRE is outperforming SPY by almost 2%. Not quite 2.7% but still a nice return.
This whole observation is getting even more interesting when you look at the rotation of asset classes. Real Estate also shows a strong rotation in this universe, pushing the tail further into the leading quadrant at a strong RRG-Heading.

Real Estate is pushing into the leading quadrant, even on the daily time frame, supporting the longer-term picture/outlook from the weekly chart.

All in all, enough reason to dig a little deeper and bring up the RRG for members of the Real Estate Sector and see if we can find any interesting setups. You can call an RRG showing all Real Estate Sector members from the drop-down selection on the RRG page.
While going over the tails for the individual stocks in this universe, I found four stocks worth further investigation, IMHO. I have highlighted/isolated these tails on the RRG below.

VNO - Vornado Realty Trust

VNIO just completed a bottoming process on both the price and the relative graph. The recent drop back should be caught by the horizontal (now) support level around $42.50. The rotation back to leading from weakening, driven by the RS-Ratio putting in a new low above 100, suggests that a new leg is underway in the relative uptrend.
ESS - Essex Property Trust Inc.

The first signs of relative weakness already started to show at the end of 2019, followed by completing a double top in price and a sharp drop at the start of 2020. That year shows a strong relative downtrend for ESS, which started to turn around towards the end of the year. In the first few months of 2021, a new series of higher highs and higher lows started to emerge.
On the price chart, the wide swings of 2020 are left behind, and recently ESS pushed above the horizontal resistance around $270, followed by a rally towards $295. In combination with further improving relative strength, the current setback to support could give a new entry opportunity.
AVB - Avalonbay Communities Inc.

AVB is another stock that shows a turnaround in relative strength during the course of 2020 and a new relative uptrend that started at the start of this year. Here also, we had wide swings in price over the course of 2020 and a recent break above the peaks around $175. A corrective move back to the $175 area, now support, will very likely be a new buying opportunity. Taking out resistance near $195 will be a strong confirmation and a sign of further improvement.
EXR - Extra Space Storage

EXR just rotated back into the leading quadrant from weakening. The RS-Line is now pushing against overhead resistance and needs to break that barrier soon to keep the positive development in relative strength. The recent break to new highs in price is definitely supporting a break higher in relative strength and a new period of outperformance for this stock.
Julius de Kempenaer
Senior Technical Analyst, StockCharts.com
Creator, Relative Rotation Graphs
Founder, RRG Research
Host of: Sector Spotlight
Please find my handles for social media channels under the Bio below.
Feedback, comments or questions are welcome at Juliusdk@stockcharts.com. I cannot promise to respond to each and every message, but I will certainly read them and, where reasonably possible, use the feedback and comments or answer questions.
To discuss RRG with me on S.C.A.N., tag me using the handle Julius_RRG.
RRG, Relative Rotation Graphs, JdK RS-Ratio, and JdK RS-Momentum are registered trademarks of RRG Research.
