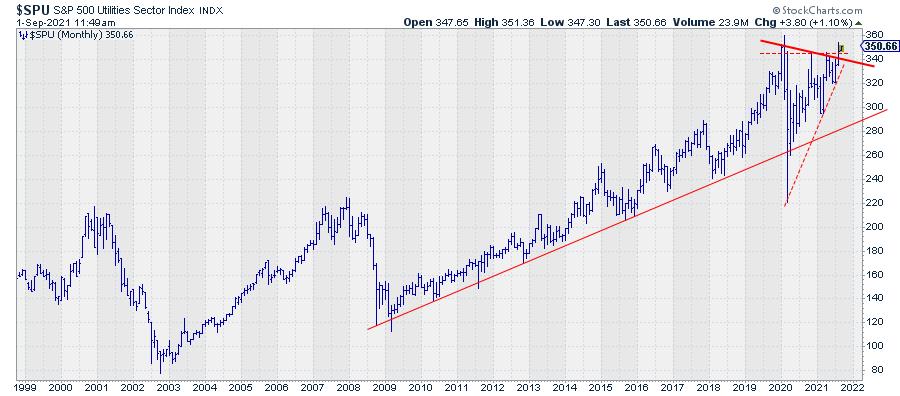
In this week's episode of Sector Spotlight, I focused on the long-term trends using monthly charts. For several months already, most sectors have been in an uptrend on these charts; only the energy sector and the utilities sector did not qualify as such (higher highs and higher lows on the monthly chart). That changed at the end of August when Utilities broke above their November-20 and April-21 highs and, at the same time, took out the slightly falling resistance coming off the early 2020 cluster of highs in Jan, Feb and March.
Obviously that's a good thing, for Utilities that is. Is it also a good thing for the market as a whole? Yes and no, I think.
Clearly, a break higher for utilities and joining all other sectors, except energy, in an uptrend is good. However, downside risks are quite extensive across the board. Also, Utilities is a notoriously DEFENSIVE sector that usually does well when the market does not do so well.
So when Utes sparks to life all of a sudden, I raise my guard.

The table above is the one that I always use in the first Sector Spotlight show of the month. It lists all sectors and the S&P 500 with a few columns of data. It is just a very rough overview, but it gives a good, kinda numerical, assessment of the state of the market.
As you can see, 5 out of 11 sectors did not reach an all-time-high nor a new closing high. Consumer Discretionary reached a new closing high, but not a new all-time-high. This means that certainly not ALL sectors are "pushing."
The "UPtrend" column is the metric I am referring to above. All sectors, except for energy, qualify as being in an uptrend. The way I "measure" this is by localizing the highs and lows on the monthly chart and judging whether that rhythm qualifies as higher highs and higher lows, i.e. an uptrend. The weight column helps me to keep an eye on which sectors are heavyweights vs the lighter sectors. Obviously, trends in heavy-weight sectors have a bigger impact on the S&P 500.
A month or two ago, I added the last column, which lists the "percentage risk" for each sector. Again, this is simply (and very roughly) measuring the distance from the current price level to the first, sometimes the second, support levels on these monthly charts. I wanted to get a feel for how much each sector could decline in price without harming the current uptrend. And, as you can see, these numbers are quite significant. And this is all the result of the super-steep rally we have seen since early 2020 and in which we still are.
So why the reservations with regard to the ability for the market to continue higher in the near term?
20% Downside Risk Across the Board
First of all, the simple observation from the table above is that most sectors and the S&P, in general, can drop 10% to 20% in price without harming the long-term uptrend. I believe that is a tradable move.
It does not mean that 100% cash is the best possible portfolio at the moment, but shaving off some of the recent gains and lightening up on equity exposure will not hurt. You could even think about implementing some sort of options strategy to protect the downside a bit while still keeping skin in the game when the market rises further without a meaningful drop.
Personally, I'd rather miss some performance on the upside than getting crushed in a sharp decline.
Opposite Rotations
Another thing that has my attention is the fact that the current sector rotation is confusing.
"Normally," whatever that may be, sectors move in herds or flocks. This means that, during a market rally, offensive sectors will lead together while, in a market decline, usually the defensive sectors will lead together. Utilities and Staples, for example, typically move along the same path.

The RRG above shows the tails for Utilities and Staples over the last 18 weeks. The opposite rotation in the last few weeks is notable. For me, that qualifies as an oddity and, very often with such oddities, the unexpected things can tell us something. The way I interpret this opposite rotation for the two most defensive sectors is uncertainty... and if there is one thing investors do not like, it is uncertainty.
Negative Divergence Remains
And finally, there still is this negative divergence between price and RSI for the S&P on the weekly chart.

The divergence became a little less strong in the past 2-3 weeks, but it is certainly still there. Also, when you add the MACD, you can see that the MACD line and the trigger line are almost overlaid on each other and moving sideways but not upward anymore -- and clearly lower than the peak in May.
All in all, I believe that the current risk/reward ratio for stocks does not justify a loaded portfolio at the moment.
#StaySafe, --Julius
Julius de Kempenaer
Senior Technical Analyst, StockCharts.com
Creator, Relative Rotation Graphs
Founder, RRG Research
Host of: Sector Spotlight
Please find my handles for social media channels under the Bio below.
Feedback, comments or questions are welcome at Juliusdk@stockcharts.com. I cannot promise to respond to each and every message, but I will certainly read them and, where reasonably possible, use the feedback and comments or answer questions.
To discuss RRG with me on S.C.A.N., tag me using the handle Julius_RRG.
RRG, Relative Rotation Graphs, JdK RS-Ratio, and JdK RS-Momentum are registered trademarks of RRG Research.
