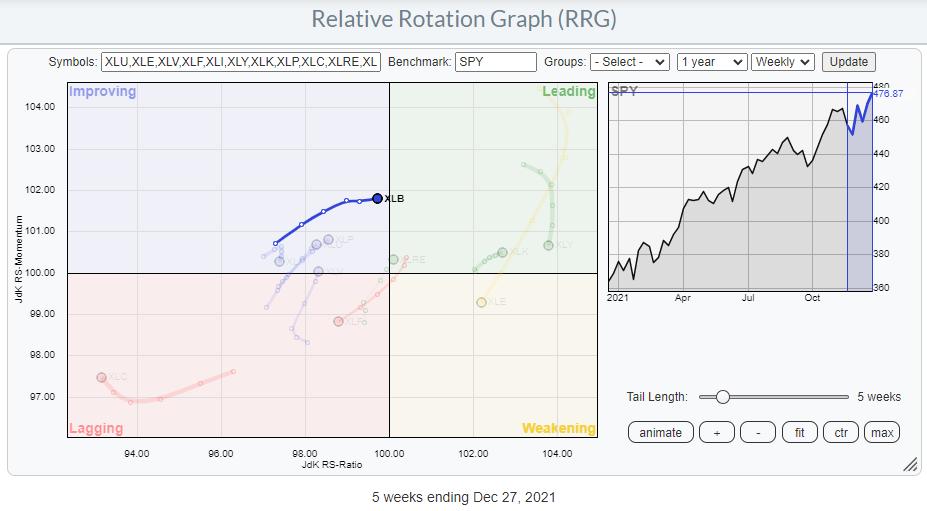
Over the past several weeks, the materials sector has continued to improve very gradually and is now on the verge of crossing over into the leading quadrant.

The bottoming process of relative strength against SPY is still ongoing and has been picked up by the RRG-Lines, which are both rising. After pushing above the 100-level in October, the rising Jdk RS-Momentum line has pulled the RS-Ratio higher and is now close to crossing above 100 as well, which will put XLB inside the leading quadrant on the Relative Rotation Graph.
In the last two weeks or so, relative momentum has faded slightly, but is still positive. It is clear that relative strength needs a new boost to cross above that dashed resistance level and push the JdK RS-Ratio line comfortably over 100.
This boost looks to be underway this week, with XLB breaking above its most recent high around 89.70. If this break can hold into Friday's close, that would be a really good sign and possible catalyst for relative strength to improve further.
In anticipation of this break, it's time to investigate what's happening to the groups inside this sector.

This RRG shows the rotations for the groups that make up the materials sector against XLB as the benchmark.
Inside the lagging quadrant, there are four groups. One is traveling upward towards the improving quadrant and close to the benchmark. That is the steel index. The other three groups, Paper, Containers&Packaging and Commodity Chemicals, are all at a negative RRG-Heading, suggesting they are better off avoided.
Non-Ferrous Metals and Specialty Chemicals are inside the leading quadrant, but are losing relative momentum. They are still strong groups, but they seem to be under relative pressure, at least temporarily.
Inside the improving quadrant, the tails for Mining and Gold Mining are almost identical. Mining is slightly ahead of Gold Mining.
Mining

The US Mining Index has been inside a broad range between 110-150 for almost two years now. The decline from 150 in May down to 110 in October brought this group to the bottom of its range.
Since October, a double bottom formation has been developing against support at 110 and is now breaking higher. The completion of this formation allows us to put a target price of around 138, while relative strength is in the process of bottoming out.
This makes the Mining group an interesting opportunity.
Gold Mining

The Gold Mining chart looks almost identical; a broad range, with the big decline in 2021. It is setting a double bottom against support and breaking away from that formation at the moment.
The price target for this group can be determined around 144. Just like for the Mining group, the break from a bottom formation and the continuing improvement in relative strength makes this an interesting group to watch.
Aluminium

Aluminium is the only group inside the weakening quadrant. But it is also the group that is highest on the RS-Ratio scale. And, even more importantly, its tail has started to move back up towards the leading quadrant. This means that the group is starting a new leg higher in an already rising relative trend.
This can be seen very well in the chart above, where the raw RS-Lines are trending upward in a series of higher highs and higher lows. The accompanying RRG-Lines are showing the RS-Ratio line above 100 since mid-2020 and the RS-Momentum line (green) oscillating around 100 a few times since. Every time the RS-Momentum line drops below 100 and then turns back above it again, that creates a rotation from leading into weakening, then back up to leading again.
The recent break to new highs in price supports a further strengthening of relative strength for this group inside the Materials sector.
Please enjoy the last days of 2021; I wish all of you a great start of 2022 and a very happy new year.
--Julius
Julius de Kempenaer
Senior Technical Analyst, StockCharts.com
Creator, Relative Rotation Graphs
Founder, RRG Research
Host of: Sector Spotlight
Please find my handles for social media channels under the Bio below.
Feedback, comments or questions are welcome at Juliusdk@stockcharts.com. I cannot promise to respond to each and every message, but I will certainly read them and, where reasonably possible, use the feedback and comments or answer questions.
To discuss RRG with me on S.C.A.N., tag me using the handle Julius_RRG.
RRG, Relative Rotation Graphs, JdK RS-Ratio, and JdK RS-Momentum are registered trademarks of RRG Research.
