TAKEAWAYS
- Materials Sector Steering Towards Leading Quadrant at Strong RRG Heading
- Twelve Stocks In the Materials Sector are at a North Eastern Trajectory
- PKG, WRK, and NUE look particularly interesting
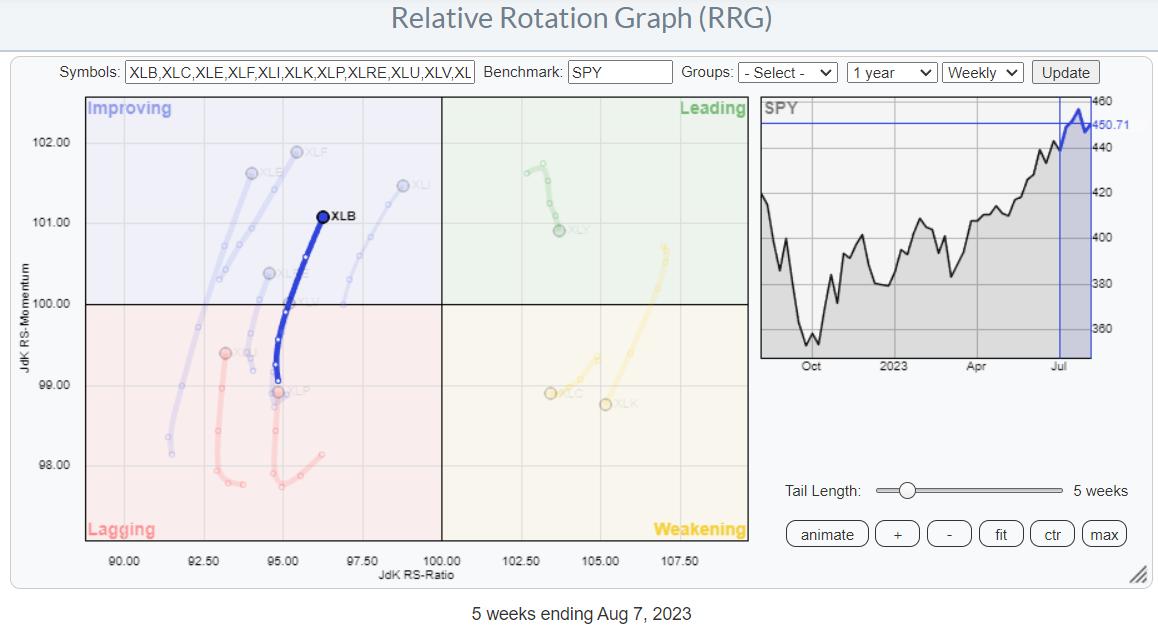
Looking at the Relative Rotation Graph for US sectors, we can see the Materials sector pops up as potentially interesting. It is still inside the improving quadrant, but has just started heading towards leading.
When you are interested in overweight/underweight strategies or pair trades, an interesting sector to watch for off-sets is technology. After a strong rotation through leading, this sector has now rolled over and is inside the weakening quadrant, heading towards lagging.
Hence, primarily from a relative momentum perspective (JdK RS-Momentum), they are now at opposite rotations. For both tails, it is still possible to complete a rotation without moving to the opposite side of the RRG.
Focus on Materials
For this article, I wanted to zoom in on the Materials sector, so I ran the RRG for the members.

Browsing through the tails on this plot, I isolated the ones that are on a strong RRG heading, i.e. pointing in a North-Eastern direction. The RRG showing these selected tails is printed below.

Going over the individual charts for these stocks, I concentrated on the tails that are close to crossing over into the leading quadrant while still low on the RS-Momentum scale. They have enough potential on both scales to continue rising on both scales, which is what causes that stronger heading between 0-90 degrees.
Packaging Corp. - PKG

The first one is PKG. The tail is very close to the benchmark, but the heading is strong and pointing toward the leading quadrant, and a crossover seems imminent.
The price chart confirms the recent strength that has been showing up in this stock. After breaking overhead resistance near 143, the price is now hitting resistance between 155-160. The steepness of the recent move creates some risk for a correction, but 143 should now start to act as support.
Given the longer-term strength it is showing on the RRG and the break to 12-month highs makes, this a stock to watch, either for entry, when a new low will be put into place after a corrective move, or when the resistance at 160 can be broken and the stocks move to new all-time highs.
WestRock Co. - WRK

WRK has recently ended its long downtrend as it executed a reversal out of a symmetrical triangle formation.
That move ended the rhythm of lower highs and lower lows, and the initial rally following the upward break has meanwhile pushed above resistance near 33.50, which was offered by the low between the double top that formed at the end of 2022-start of 2023. With these resistance levels taken out, the upside potential for WRK now reaches up to 37.50. But more importantly, the downtrend in relative strength has now reversed as well.
The JdK RS-Momentum line is already moving above 100 and is dragging RS-Ratio higher. Given the current strength in price, it seems only a matter of time before the tail on WRK will hit the leading quadrant. Ideally, any low at or above 33.50 can be seen as a good entry-level to participate in a further move toward 37.50.
Nucor - NUE
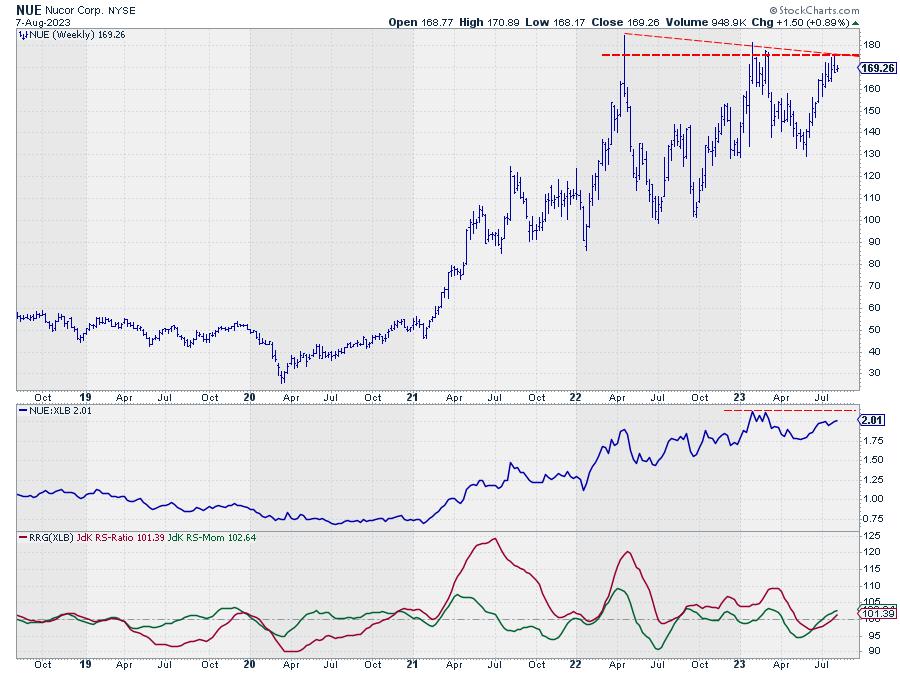
Finally, we have Nucor. This stock is the only one out of this group that has already crossed over into the leading quadrant, ready to travel further at a strong RRG heading.
From a price perspective, all the major lows since early 2022 came in at higher levels, indicating the underlying demand for this stock. The big hurdle to be faced right now is the horizontal barrier at 175. As you can see, this is where, roughly, the horizontal overhead resistance coming from the major highs of 2022 and early 2023 is coming in. And it is also the level where the slightly falling resistance line over the extreme highs of 2022 and 2023 runs at the moment. Once Nucor can take out this double resistance level, much more upside potential will be unlocked.
Relative strength has improved, which has caused the RRG lines to continue higher above 100 in tandem. But taking out the relative high of early 2023 will be the confirmation for more outperformance.
#Stayalert, --Julius
Julius de Kempenaer
Senior Technical Analyst, StockCharts.com
Creator, Relative Rotation Graphs
Founder, RRG Research
Host of: Sector Spotlight
Please find my handles for social media channels under the Bio below.
Feedback, comments or questions are welcome at Juliusdk@stockcharts.com. I cannot promise to respond to each and every message, but I will certainly read them and, where reasonably possible, use the feedback and comments or answer questions.
To discuss RRG with me on S.C.A.N., tag me using the handle Julius_RRG.
RRG, Relative Rotation Graphs, JdK RS-Ratio, and JdK RS-Momentum are registered trademarks of RRG Research.
