TAKEAWAYS
- Three Sectors Are Ready to Rotate Back Towards the Leading Quadrant
- Technology, Discretionary, and Communication Services Together Are Almost Half Of Total Market Cap
- Daily Tails for these sectors are supporting the looming positive rotation for their weekly counterparts
First of all, for those who are awaiting a new episode of Sector Spotlight, I have just arrived at the StockCharts.com office in Redmond, WA, and the airline did not allow me to record a video while in the air ;)
I am going to try to squeeze a fresh episode of SSL in this week, but I'm not sure which day it will be, so stay tuned. I will be joining Dave Keller on The Final Bar on Wednesday the 13th. I will also be recording a new episode of Charting Forward this week together with Tom Bowley, Mish Schneider, and Dave hosting. So plenty of studio time ahead for me.
Weekly Sector Rotation
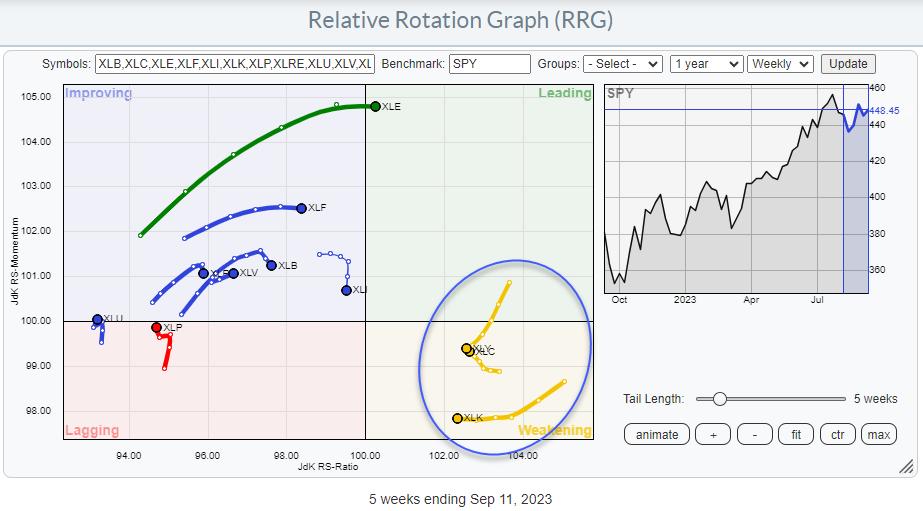
The Relative Rotation Graph at the start of this week shows three important sectors inside the weakening quadrant: Consumer Discretionary (11%), Technology (28%), and Communication Services (8%). Together, these sectors represent 47% of the total market capitalization of the S&P 500.
All three have gone through a relative setback over the last 5-10 weeks, but, looking at their current tails, it seems like they are leveling off in terms of JdK RS-Momentum with enough room left inside the weakening quadrant to curl back up and start a new rotation towards leading.
Daily Rotation

Zooming in on the daily version of this RRG reveals that all three of these sectors are improving rapidly at the moment. XLK is already well inside the leading quadrant and still moving higher on the RS-Ratio scale while slightly losing some relative momentum. XLY has just crossed into the leading quadrant and started to accelerate. This can be concluded from the increasing distance between the nodes on the RRG-Tail (RRG-Velocity). The weekly tail on XLY needs the most work, as it is still on a negative RRG-Heading, but this rapid improvement on the daily is encouraging.
Finally, there's XLC. On the daily RRG, the tail turned back up aggressively in the last week and that improvement is now accelerating, resulting in a higher RRG-Velocity as well just like XLY. This turn should fuel the further improvement for XLC on the weekly RRG.
Information Technology

Since mid-June, XLK has been testing the area around the all-time high, which was set back in 2021, but, so far, there has not been a clear upward break. However, the upward trend coming out of the 2022 low is still fully intact, and the market tested and confirmed this rising channel a few weeks back with a new higher low. All in all, things are still looking good from a price perspective. A rise above 180 would be the final confirmation and, most likely, the trigger for a new acceleration higher.
Relative strength moved sideways after its initial break above the late-2021 high. As a result, both RRG-Lines dropped back with RS-Momentum sinking below 100, pushing the tail into the weakening quadrant. A continued improvement of relative strength on the daily time frame will be needed to fuel this improvement on the weekly RRG and really push things forward upward.
Consumer Discretionary

On the price chart of XLY, a rising channel is starting to become more and more visible. The rising support line emerging out of the late 2022 low just got more reliable with a new touch point a few weeks ago. There is some medium resistance to be expected around the level of the most recent high, just shy of 178. Once that can be taken out, more important resistance will come in sight around 187.50. All in all, the outlook for price is pretty good.
The relative strength chart shows a nice re-test of old resistance as support when the most recent low was put into place at the level of the February relative high. On this weekly chart, the RRG lines are losing a bit of ground. But things seem to be turning around rapidly on the daily chart.

Communication Services

Out of the three mentioned sectors, XLC has already started its rotation back up toward the leading quadrant.
On the price chart, XLC continues to move nicely inside the boundaries of the rising channel that emerged out of the October 2022 low. The recent new higher low once again confirmed the validity of this channel.
Overhead resistance is now coming in around 70, where a horizontal level is lining up over the highs of March 2022 and July 2023 and two minor lows back in 2021. When the market can take out that barrier, another acceleration within the rising trend may be expected. The next target area is found near 72.50.
The rise in relative strength has slowed down slightly, but the trend is still up. This slowdown caused the RRG-Lines to dip slightly, but, with RS-Momentum already back on the rise, things are shaping up for a renewed relative rally in XLC in the coming weeks.
With three important sectors, XLK, XLY, and XLC, ready to turn back up inside the weakening quadrant, things seem to be shaping up positively for the market as a whole.
#StayAkert, --Julius
Julius de Kempenaer
Senior Technical Analyst, StockCharts.com
Creator, Relative Rotation Graphs
Founder, RRG Research
Host of: Sector Spotlight
Please find my handles for social media channels under the Bio below.
Feedback, comments or questions are welcome at Juliusdk@stockcharts.com. I cannot promise to respond to each and every message, but I will certainly read them and, where reasonably possible, use the feedback and comments or answer questions.
To discuss RRG with me on S.C.A.N., tag me using the handle Julius_RRG.
RRG, Relative Rotation Graphs, JdK RS-Ratio, and JdK RS-Momentum are registered trademarks of RRG Research.
