RRG Charts March 27, 2024 at 06:48 PM
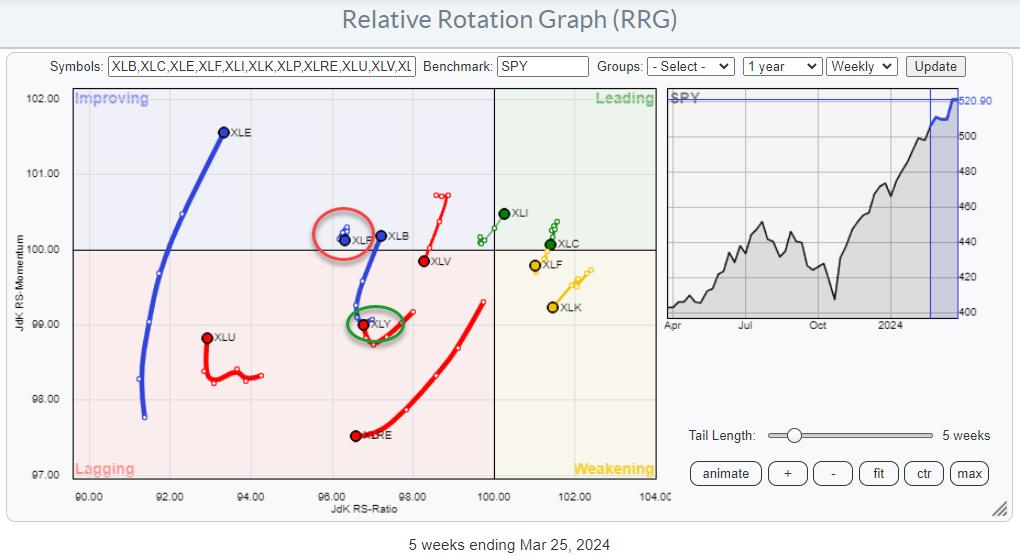
Summary The Relative Rotation Graph for US Sectors for this week mainly shows a continuation of the rotations as they were underway last week... Read More
RRG Charts March 19, 2024 at 06:14 PM
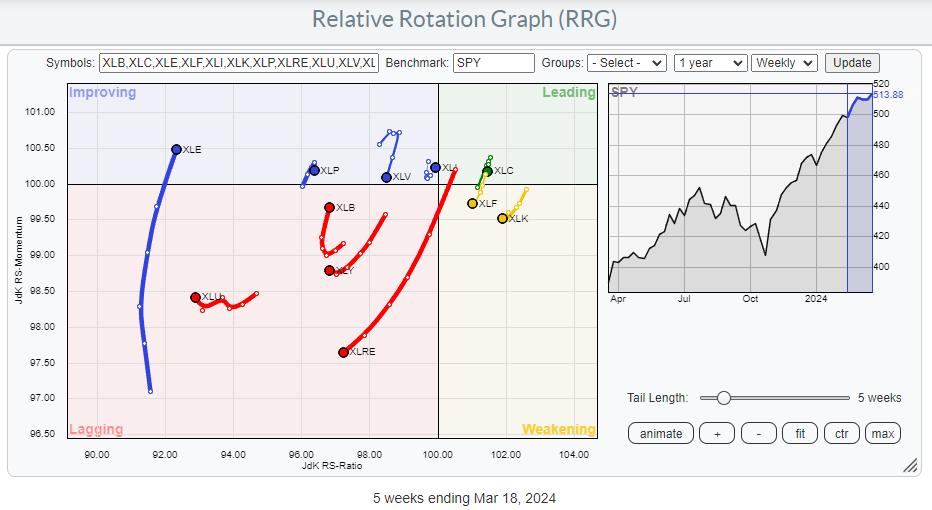
Energy Improving in Three Time Frames Watching the sector rotation at the start of this week shows a continued improvement for the Energy sector (XLE)... Read More
RRG Charts March 08, 2024 at 03:26 PM
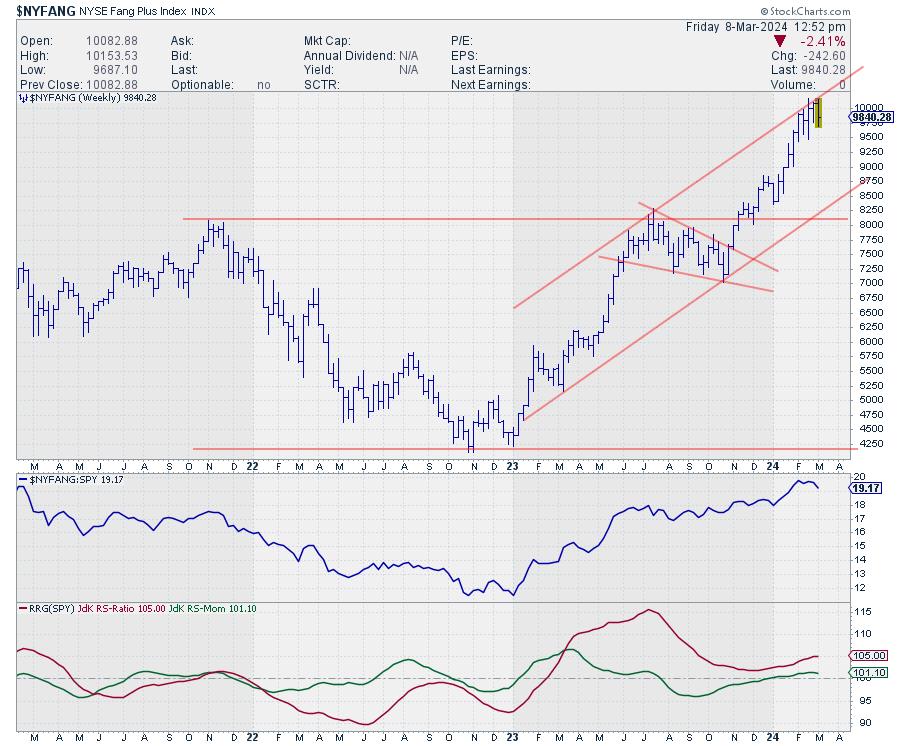
It is no secret that the NYFANG+ Index is still in in incredible up-run after bottoming out in October last year and subsequently breaking significant overhead resistance around 8.000. In the last 3-5 weeks, the index stalled just below 10.000 and moved sideways... Read More