Market Recap for Tuesday, January 2, 2018
The NASDAQ loves January and January loves the NASDAQ. If there's one month where the NASDAQ really shines on a relative basis, it's January (see Historical Tendencies below) and that index opened the new year like it owns January. It was a very solid day across most areas, but the NASDAQ's 1.50% push higher easily outperformed its index peers and it also enabled the index to do something it's never done before - close above 7000. It wasn't too long ago when we wondered if the NASDAQ would ever reach those year 2000 highs above 5200. That is so far in the rear view mirror now as the next question is how long will it take the index to reach 10,000?
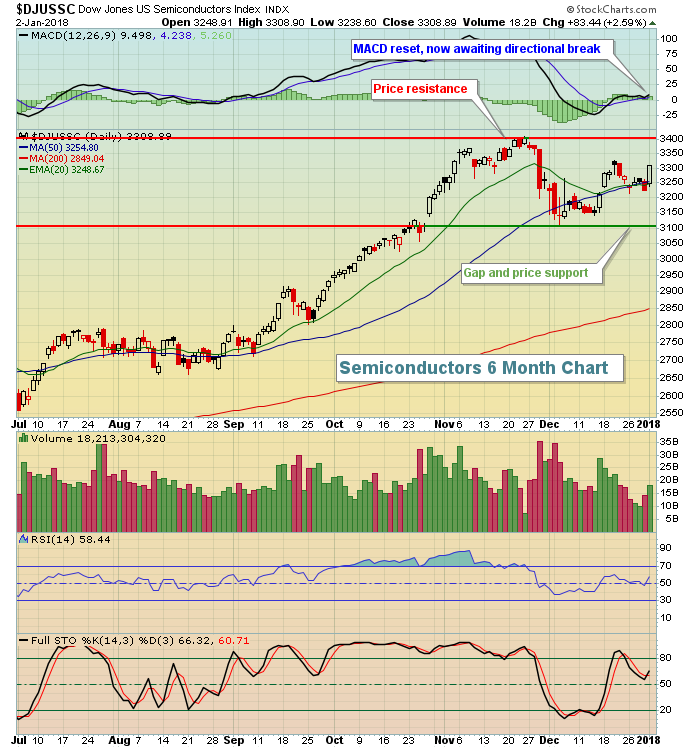
Leadership came from many sectors and industry groups. For the NASDAQ, though, the bounce back in semiconductors ($DJUSSC) was perhaps the best news from 2018's first trading day. The group had floundered for the last 5-6 weeks of 2017, but there was no floundering on Tuesday. The DJUSSC raced out of the starting gate and then finished on its high with expanding volume. Clear price support and price resistance levels have now been established. Since the DJUSSC was a major leader in 2017, a fresh breakout would be extremely bullish for this industry and for the NASDAQ. Here's the latest DJUSSC chart:
 While the semiconductors rose a very nice 2.59% on the opening session of the year and the NASDAQ led the day's advance, technology (XLK, +1.24%) wasn't the big winner. Energy (XLE, +1.65%) began 2018 in the same fashion it ended 2017 - leading all of the other sectors and displaying excellent relative strength vs. the benchmark S&P 500. It enabled the XLE:$SPX to close at its highest relative level since late-May:
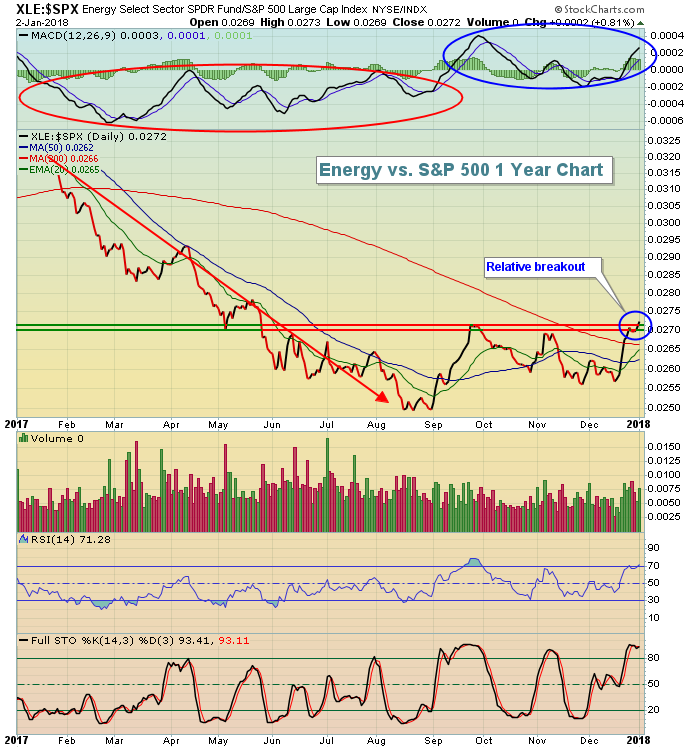 Energy is a sector that you want exposure to. As traders, we should be looking to outperform the benchmark S&P 500. One way to do that is to concentrate on sectors that are showing considerable relative strength and breaking to new relative highs - or at least showing relative strength.
The laggards to open 2018? There was no debate. Utilities (XLU, -0.93%) struggled mightily as a resumption to the upside in treasury yields squashed any attempt by the XLU to build on its strength from late last week. Consumer staples (XLP, - 0.62%) was the other sector that fell on Tuesday.
Pre-Market Action
Treasury prices and gold ($GOLD) are relatively flat this morning, while crude oil ($WTIC) is up 0.71% to near the $61 per barrel level. The further rise in crude should continue to provide tailwinds for energy shares on the second trading day of 2018.
Asian markets were mixed overnight, but European shares are trying to join the global stock party this morning. The German DAX ($DAX), which has been threatening to lose support in the 12800-12900 area, is higher by 67 points, or 0.52%, this morning.
Dow Jones futures are looking to extend yesterday's gains, up 54 points.
Current Outlook
While it's always frustrating in an uptrend to allow consolidation and profit taking to play out, the last three months on the NASDAQ have provided a case study in patience and discipline. Check out the chart:
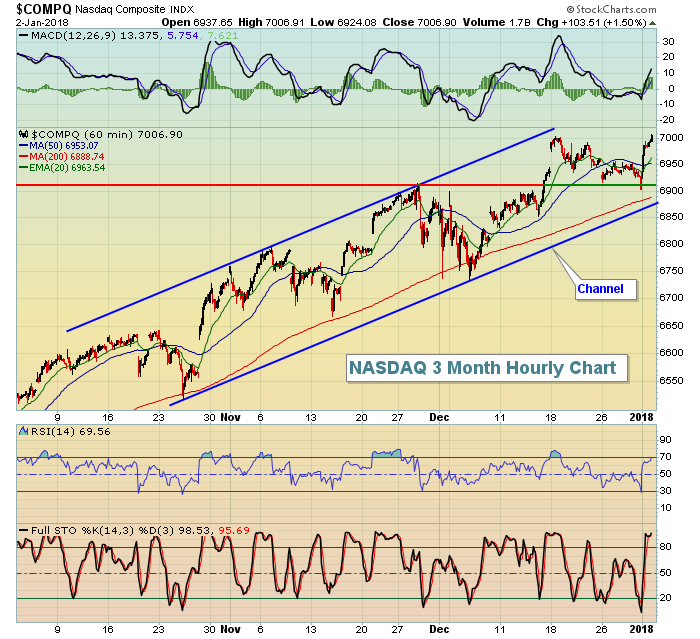 The NASDAQ's channel is quite clear if you have the time to take a breath, step back and look at a longer-term period than just a week or two. The above three month chart shows a near perfect channel and the hourly MACD is just now beginning to turn higher. That's a sign of accelerating bullish price momentum. During such periods of acceleration, the 20 hour EMA typically provides excellent support. Therefore, short-term traders should view the next 20 hour EMA test as an opportunity to put more capital to work.
Sector/Industry Watch
Automobiles ($DJUSAU) are part of the red-hot consumer discretionary space (XLY, +1.52%) and continue to act in very bullish fashion. The following is a daily chart that shows the group currently consolidating in sideways fashion with price support and price resistance clearly depicted:
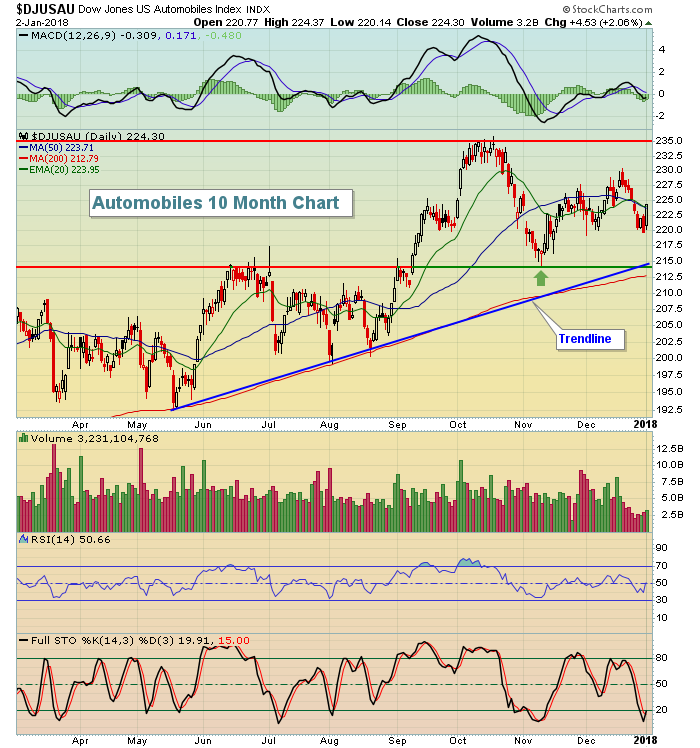 While it may appear that the DJUSAU is simply churning back and forth, stepping back to look at the long-term weekly picture here shows a group that's clearly rising with successful 20 week EMA tests already in the books:
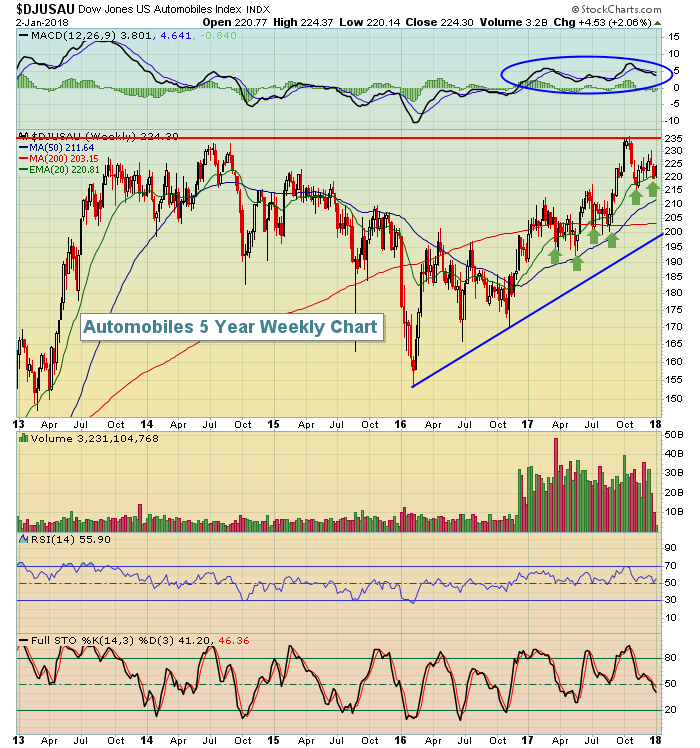 The green arrows mark bounces off of or very near the rising 20 week EMA. And the MACD has now been above the centerline for more than a year, also an indication of a rising group.
Historical Tendencies
The NASDAQ's relative strength (vs. S&P 500) is most apparent in January. Over the past 20 years, the NASDAQ has averaged beating the S&P 500 by 1.3%. On an annualized basis, that's more than 15%. The NASDAQ has outperformed the S&P 500 14 of the last 20 years, or at a 70% clip. That's higher than any other calendar month.
The NASDAQ has produced annualized returns of +31.72% during the month of January since 1971, by far its best month of the year. December's annualized return of +23.44% ranks second.
Key Earnings Reports
None
Key Economic Reports
December ISM manufacturing to be released at 10:00am EST: 58.0 (estimate)
November construction spending to be released at 10:00am EST: +0.6% (estimate)
FOMC minutes to be released at 2:00pm EST
Happy trading!
Tom
