Market Recap for Friday, August 31, 2018
Friday's action was underscored by bifurcation. The NASDAQ and small cap Russell 2000 turned in solid gains of +0.26% and +0.48%, respectively, while the Dow Jones ended the day in negative territory. The S&P 500 was essentially flat. Among sectors, consumer discretionary (XLY, +0.39%) thrived and technology (XLK, +0.08%) and industrials (XLI, +0.06%) ended the week in positive territory. But energy (XLE, -0.77%) sold off a bit after challenging its 20 day EMA and 50 day SMA last week. Its PPO resides in negative territory, unable to clear centerline resistance despite a solid two week advance. Action in energy remains quite choppy.
Apparel retailers ($DJUSRA) are acting quite bullishly, bouncing as the group neared its rising 20 day EMA last week:
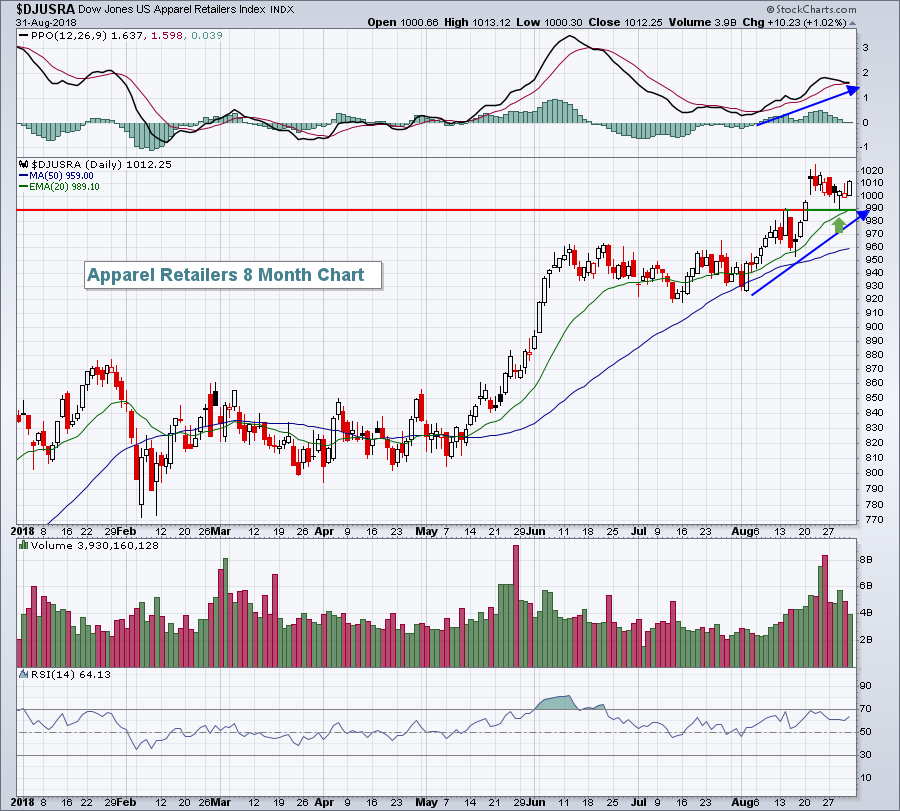 Volume was heavy to accompany the latest price breakout. I'd look for further strength in the DJUSRA as we approach the fourth quarter. Short-term price support and the rising 20 day EMA both reside near 990 so that would be an initial area to consider the group.
While most areas of consumer discretionary performed well on Friday, toys ($DJUSTY) was a definite exception as this industry group fell 1.99% to close at a 3 month low. It's worth noting that the DJUSTY historically has struggled from September through December, on average gaining just +0.3% during this four month period over the past two decades. The first quarter is when the DJUSTY tends to shine.
Pre-Market Action
The 10 year treasury yield ($TNX) is higher by nearly 3 basis points to 2.88% this morning and crude oil ($WTIC) is spiking. The WTIC is up more than 2% as Tropical Storm Gordon approaches evacuated oil rigs in the Gulf of Mexico. That should lead to outperformance by many energy shares today.
The U.S. Dollar Index ($USD) is off to a strong early start this week and it's taking a toll on gold ($GOLD), which is threatening to move back below $1200 per ounce. Silver ($SILVER) and copper ($COPPER) are both getting hit hard, down more than 2% each this morning.
Asian markets were mixed overnight, but there's concerted selling in Europe this morning with the German DAX ($DAX) down 145 points, or 1.18%. That's led to a weak pre-market here in the U.S. Dow Jones futures are pointing to a drop of roughly 75 points less than 30 minutes before the opening bell.
Current Outlook
As we begin the most bearish month of the year historically, the technical setup remains quite bullish. I always like to follow the XLY:XLP ratio to see how consumer stocks are performing relative to one another and the XLY has regained its leadership role - a bullish signal:
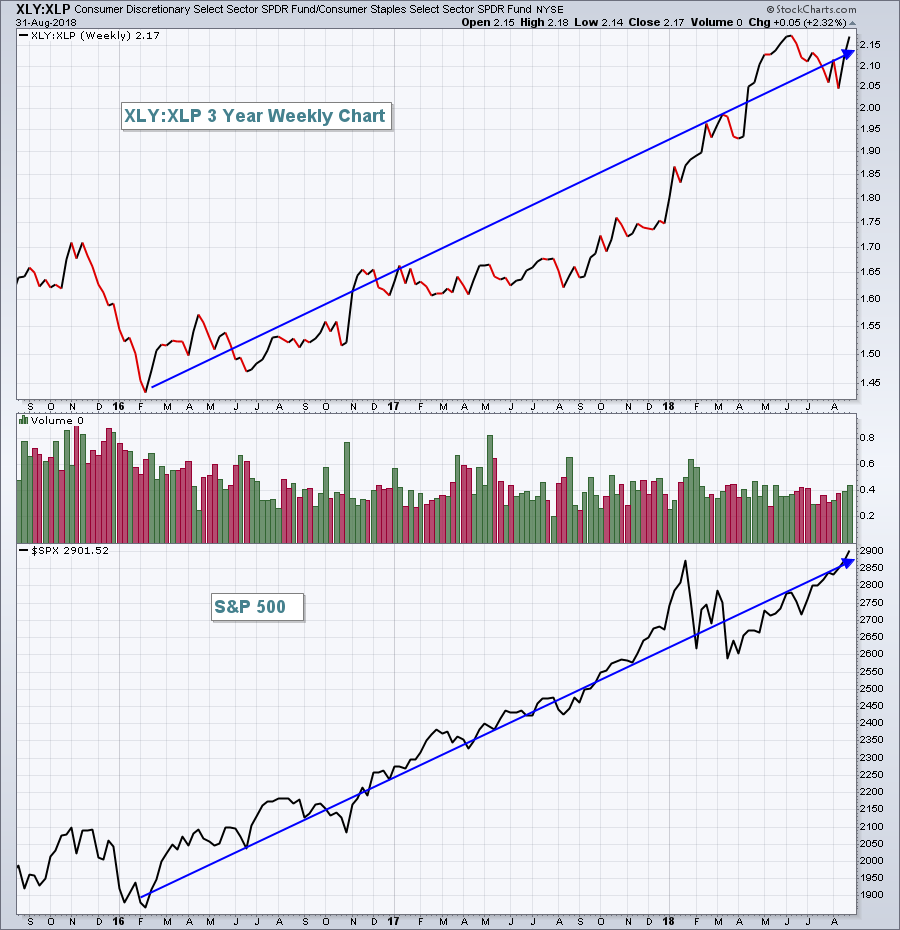 Money has been rotating to the more aggressive consumer discretionary area (XLY) throughout the past 2 1/2 year rally. That's very obvious to me and it's difficult to interpret this rotation as anything other than very bullish. I don't look at this on a day-to-day basis as the market rotates constantly throughout the day and week. But stepping back and looking at the long-term picture enables us to decipher what's truly taking place "under the surface" of the market. Don't be shocked to see the XLY:XLP move sideways for quite some time as this ratio has had a huge run higher in 2018. Relative consolidation is bullish in my view as well.
Sector/Industry Watch
Retailers continue to dominate on a relative basis - not only relative to the benchmark S&P 500, but also to their consumer discretionary peers. Broadline retail ($DJUSRB) is up more than 21% in the past three months. Yes, Amazon.com (AMZN) has a lot to do with that, but there are plenty of others in this space that are moving higher with accelerating momentum. Among large caps, Target (TGT) recently reported stellar quarterly results and among small caps there's Ollie's Bargain Outlet Holdings (OLLI):
Check out these two charts:
TGT:
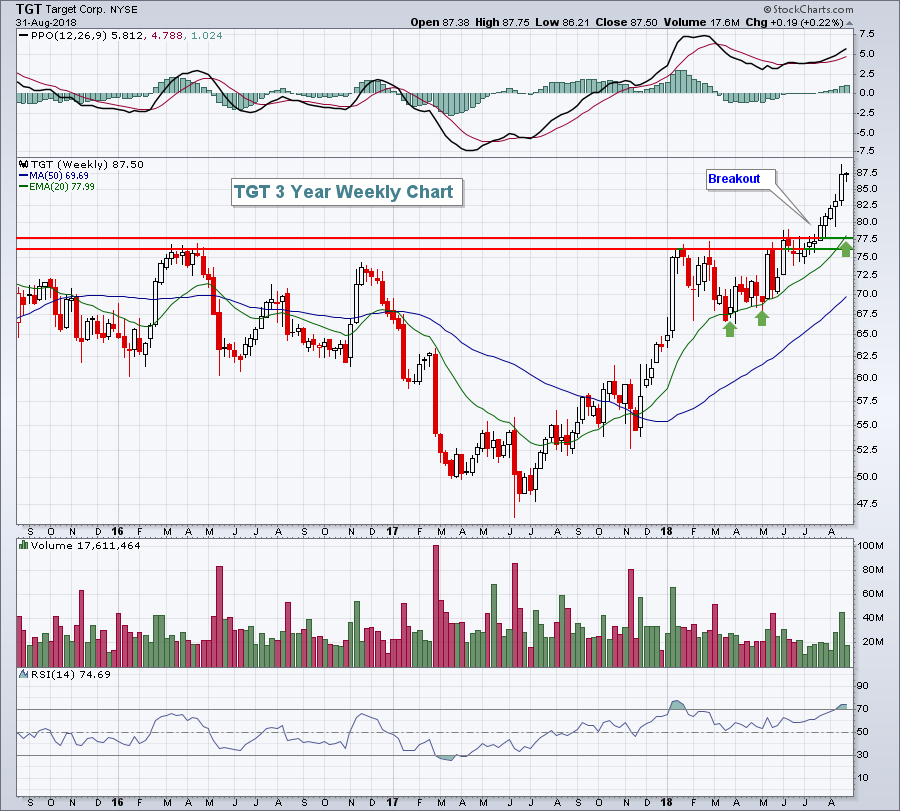 It's been a great run for TGT since the low in March and it's now quite overbought with its weekly RSI at 75, but a pullback would create a great entry opportunity. I suspect that TGT is just beginning a lengthy uptrend as it's getting much more than its fair share of broadline retail money.
OLLI:
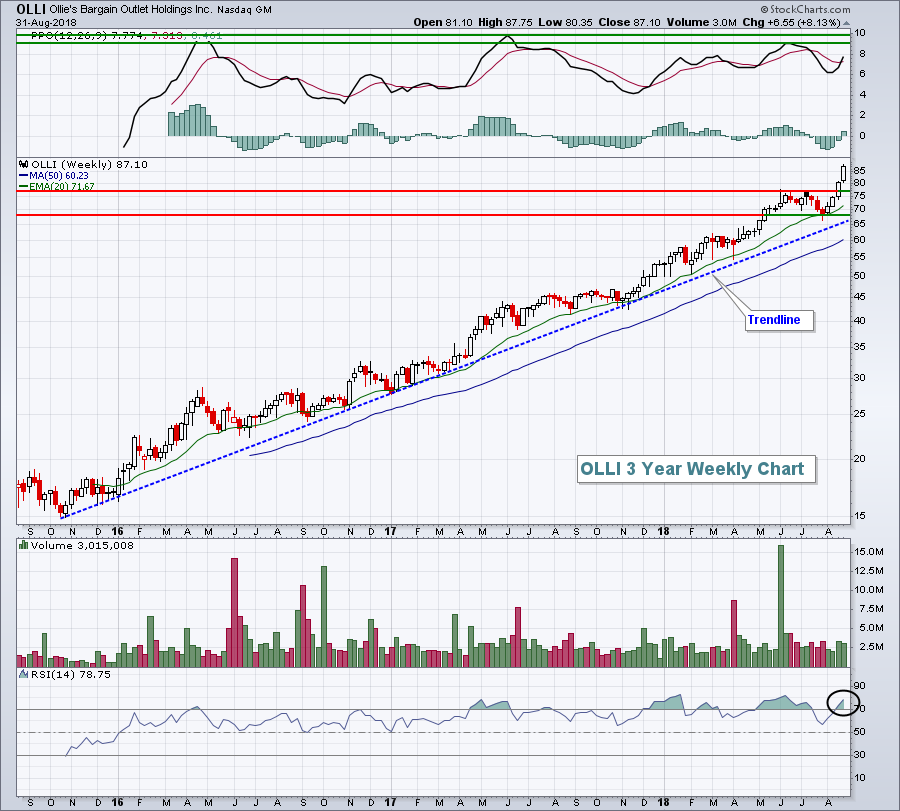 There aren't many stocks that can boast a longer-term track record better than AMZN, but OLLI has been one of them. There's been tremendous volume, which suggests accumulation. Like TGT, however, OLLI is overbought and any time you see a PPO get up near 10, the stock is in fairly desperate need of a pullback. I wouldn't chase OLLI, but I'd certainly keep it on a Watch List and consider entry on future pullbacks.
Monday Setups
My pick for this week is Assurant, Inc. (AIZ). There are several reasons for this selection. First, the weekly chart shows that AIZ is nearing its rising 20 week EMA, typically a good signal for entry. Second, AIZ had broken out above highs last summer on strong volume and the recent pullback is simply testing that breakout level. Third, AIZ loves the month of September. Its risen nearly 80% of Septembers over the past 15 years and its average September return is +2.6%, which is quite strong when you consider that the benchmark S&P 500 has averaged gaining just 0.5% during September over that same 15 year stretch. Finally, I like the reversing candlestick from Friday and the daily RSI of 40:
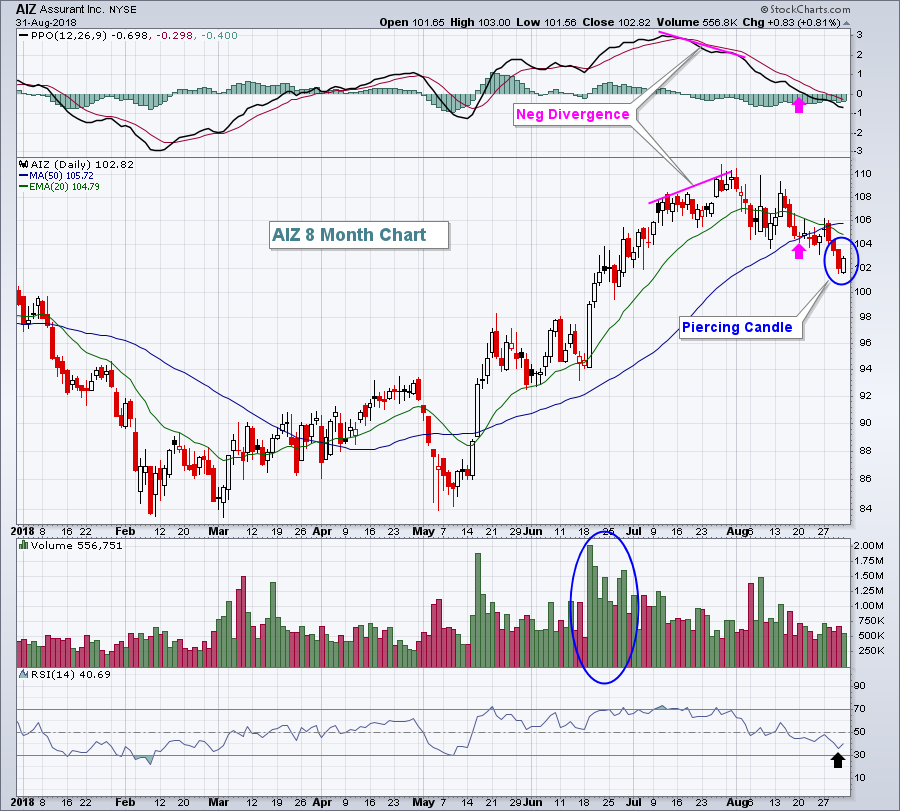 The recent weakness shouldn't come as a shock. AIZ was overbought and volume began to dwindle in late July as a negative divergence printed. The recent selling is an opportunity in my opinion.
For all five of my trade setups for this week, CLICK HERE.
Historical Tendencies
September is the worst calendar month of the year on the S&P 500, producing annualized returns of -5.58% since 1950. It's not much better on the NASDAQ (since 1971) and Russell 2000 (since 1987).
Key Earnings Reports
(reports after close, estimate provided):
WDAY: .26
Key Economic Reports
August PMI manufacturing index to be released at 9:45am EST: 54.5 (estimate)
August ISM manufacturing index to be released at 10:00am EST: 57.7 (estimate)
July construction spending to be released at 10:00am EST: +0.4% (estimate)
Happy trading!
Tom
