Latest News


The MEM Edge1d ago

MEM TV: Here's How to Trade Explosive Stocks After Earnings
In this episode of StockCharts TV's The MEM Edge, Mary Ellen reviews the current market conditions and key areas of growth that are in new uptrends. She then shares how to trade downtrend reversals and stocks that gap up after reporting strong earnings Read More
The MEM Edge1d ago

Major Shifts Taking Place As Lower Rate Bets Increase
Both the S&P 500 and the NASDAQ are sitting at new highs as we wind down a very positive earning season. So far, almost 80% of S&P 500 companies have reported a positive earnings surprise, with the year-over-year earnings growth rate at the highest level since Q2 of 2022 Read More
StockCharts In Focus1d ago

The Most Efficient Way To Follow The Markets - Customize Your Dashboard!
On this week's edition of StockCharts TV's StockCharts in Focus, Grayson walks you through the "heart and soul" of StockCharts - Your Dashboard - and explains how he customizes his layout to serve as a one-stop-shop for following the latest market action Read More
GoNoGo Charts1d ago
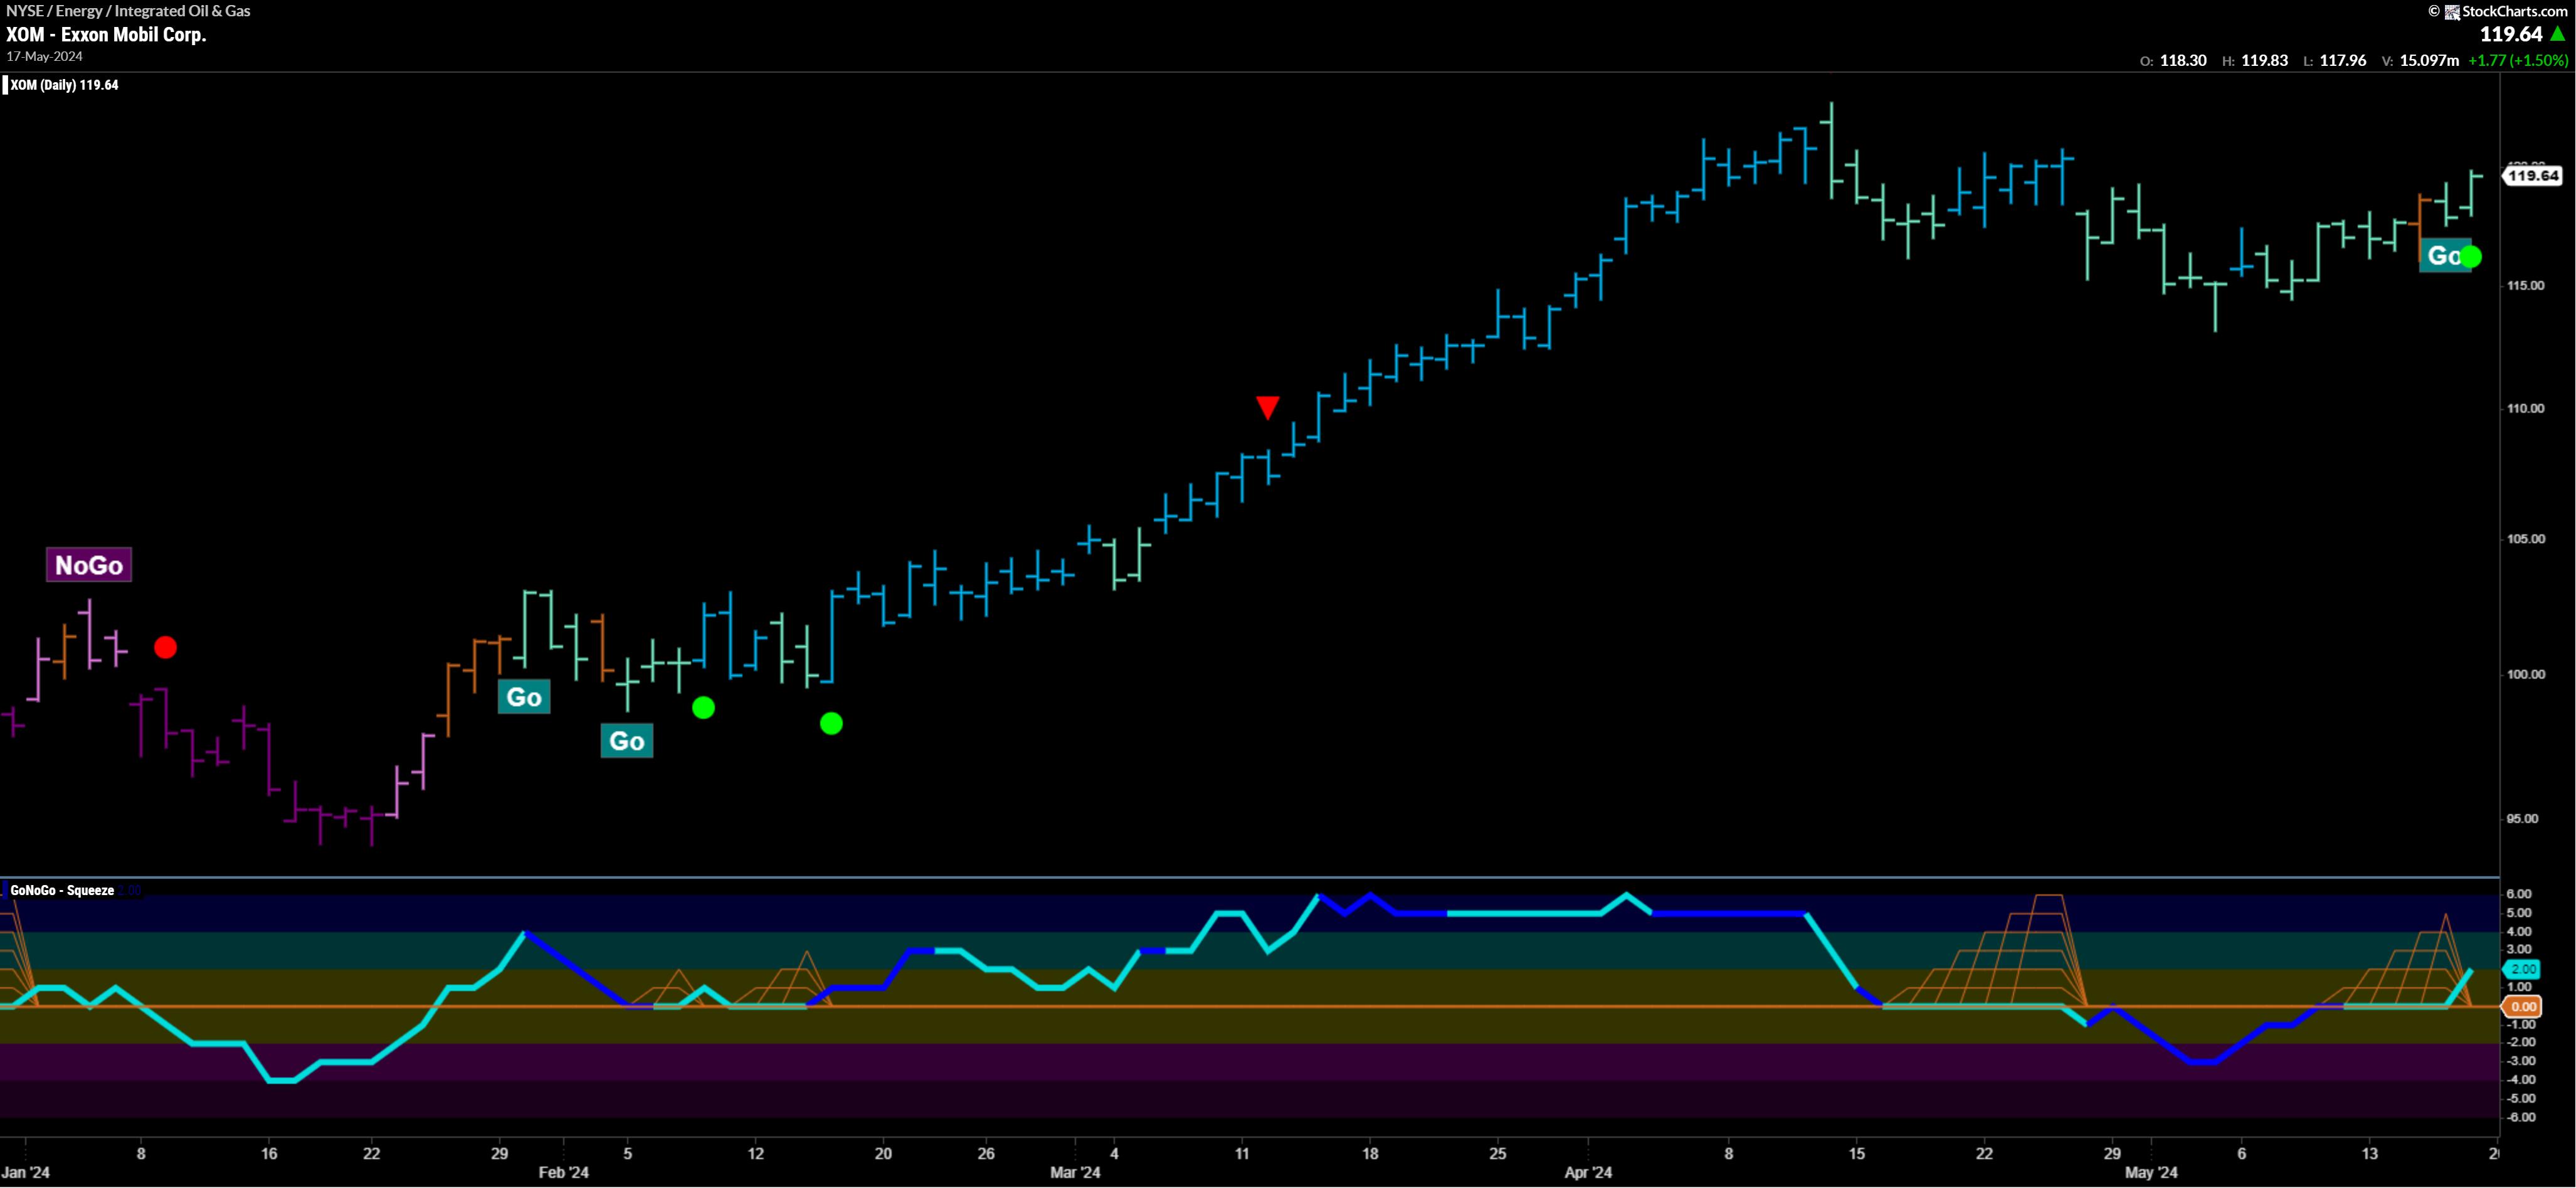
Top 5 Stocks in "Go" Trends | Fri May 17, 2024
Top 5 Stocks in "Go" Trends Trend Continuation on Rising Momentum GoNoGo Charts® highlight low-risk opportunities for trend participation with intuitive icons directly in the price action Read More
The Mindful Investor1d ago

The One Chart to Watch as S&P 500 Makes New All-Time Highs
As the S&P 500 and Nasdaq 100 have once again made new all-time highs, and the Dow Jones Industrial Average has briefly broken above the 40,000 level for the first time, how should we think about further upside for our equity benchmarks? There are two general ways to play a chart Read More
ChartWatchers1d ago

Thrilling Week for the Stock Market: Dow Jones Makes Strong Close Above 40,000 for the First Time
It made it! The Dow Jones Industrial Average ($INDU) closed above 40,000 for the first time, another record close for the index. What an exciting week! And most of that excitement came in the last few minutes of the trading week. We'll take it Read More
The Final Bar1d ago
TOP 10 Stock Picks for May 2024
In this edition of StockCharts TV's The Final Bar, join Dave and Grayson as they run through the top 10 charts to watch in May 2024! They'll cover breakout strategies, moving average techniques, relative strength, and much more Read More
DecisionPoint1d ago

Gold Is Doing Great!
While we don't typically begin with a monthly chart, it seems like a good place to start, as most of the good news is present there. Beginning on the left side, we can see how gold made a parabolic advance into an all-time high in 2011 Read More
Don't Ignore This Chart!1d ago

Gold and Silver Set to Smash Records: Could 2024 Be Their Biggest Year Yet?
Gold is on the verge of breaking into all-time high territory, and silver is poised to challenge its four-year highs. Both metals are rallying, and it seems probable that both assets will rise above the current threshold levels Read More
RRG Charts1d ago

Is This the Magic Upward Break Everybody Was Waiting For?
No Confirmation In Volume This week, the S&P 500 is breaking out above its previous high, undeniably a bullish sign. After the initial break on Wednesday, the market held up well on Thursday. However, a few things are holding me back from getting overly enthusiastic Read More
Art's Charts1d ago

Bitcoin Sets Up with Classic Continuation Signal
There is a certain ebb and flow in uptrends. Often we see some sort of stair step higher with big advances and smaller corrections along the way. In Dow Theory terms, the primary trend is up and declines within a primary uptrends are considered secondary price moves Read More
The Final Bar2d ago
Larry Williams: Dow 40k, Cycle Analysis, and Lessons Learned
In this edition of StockCharts TV's The Final Bar, legendary trader and author Larry Williams joins Dave in the StockCharts TV studio Read More
DecisionPoint2d ago
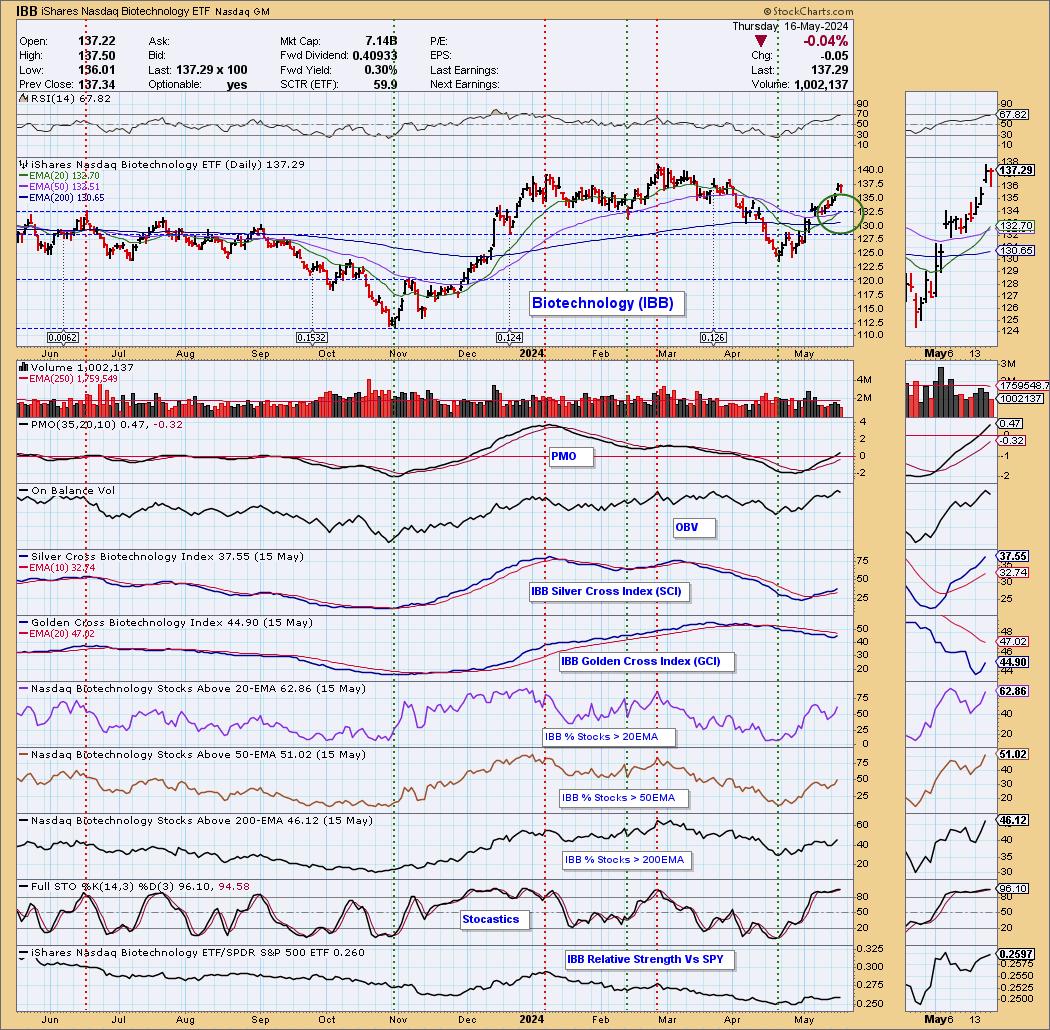
Biotechnology (IBB) Gets Silver Cross BUY Signal
Today, the Biotechnology ETF (IBB) 20-day EMA crossed up through the 50-day EMA (Silver Cross), generating an IT Trend Model BUY Signal. If we look "under the hood," we can see that participation continues to expand Read More
Dancing with the Trend2d ago

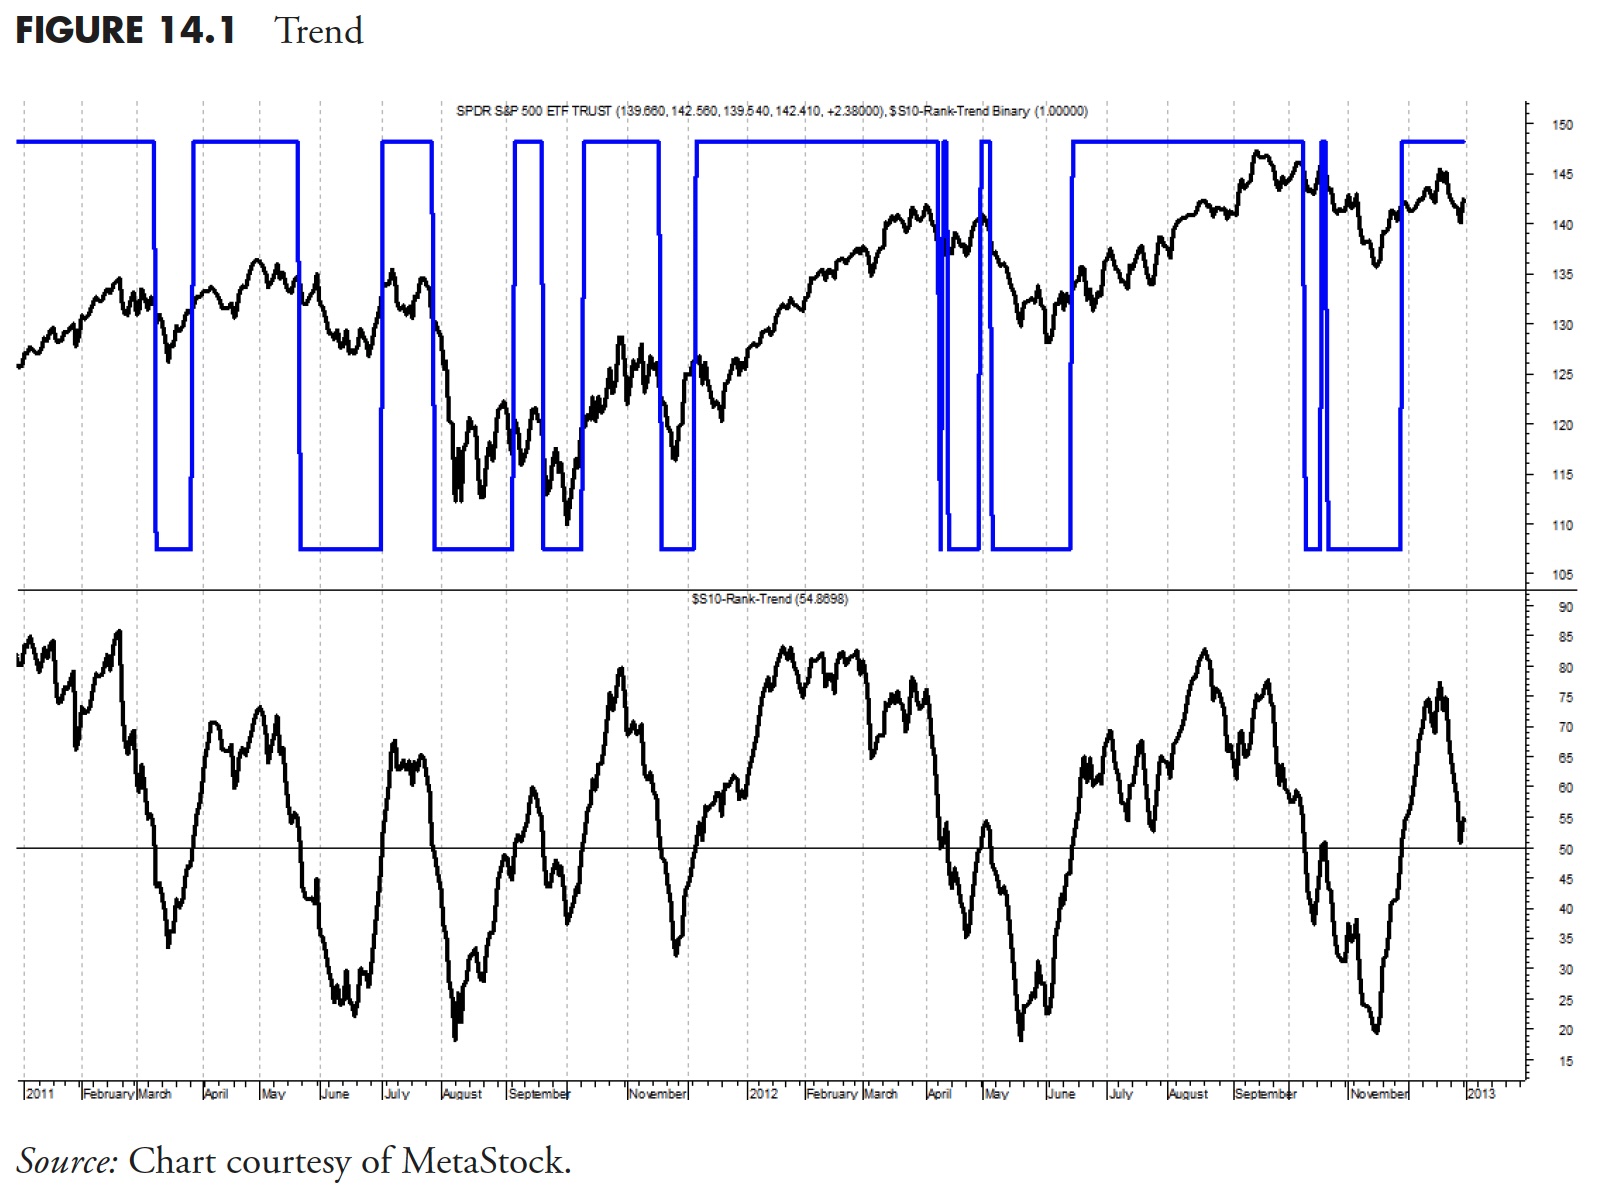
Rules-Based Money Management - Part 5: Security Selection, Rules, and Guidelines
Note to the reader: This is the twenty-first in a series of articles I'm publishing here taken from my book, "Investing with the Trend." Hopefully, you will find this content useful Read More
ChartWatchers3d ago

A Grand Slam: Broader Stock Market Indexes Soar to New Highs
The bull market hasn't gone anywhere. Despite of worrying about the possibility of a correction and a long wait for movement in either direction, the stock market has finally showed its prowess Read More
Stock Talk with Joe Rabil3d ago
Powerful Entry Strategy Using One Moving Average
On this week's edition of Stock Talk with Joe Rabil, Joe explains how to use one SMA to pinpoint great entries in pullback plays, demonstrating how it can develop in slightly different ways Read More
OptionsPlay3d ago
Master The Most Underutilized Options Income Strategy: Cash-Secured Puts
In this exclusive interview, StockCharts' David Keller, CMT, sits down with Jessica Inskip, Director of Education and Product at OptionsPlay Read More
The Final Bar4d ago

China Tariffs Drive Upside for Rare Earth Minerals
In this edition of StockCharts TV's The Final Bar, Dave welcomes Mish Schneider of MarketGauge. Mish breaks down one materials name that could benefit from recently announced China tariffs, and describes how regional banks could benefit from Fed actions in 2024 Read More
OptionsPlay4d ago
Salesforce Falls Out of Favor: Trade the Bear Put Spread Options Strategy
Once a darling of the tech industry, Salesforce (CRM) had fallen out of favor until recently, when it hit a new all-time high earlier this year Read More
Members Only
Larry Williams Focus On Stocks4d ago
Larry's LIVE "Family Gathering" Webinar Airs THIS WEEK - Thursday, May 16 at 2 PM EDT!
ChartWatchers4d ago

Meme Stock Frenzy Back In the Spotlight: Are Traders Losing Patience?
It's CPI and PPI week, and traders seem to be waiting for the data before making investment decisions. While that's happening, surprising action is brewing in meme stocks Read More
Members Only
Martin Pring's Market Roundup5d ago
Four Reasons Why Emerging Markets are Headed Higher
Last February, I wrote an article on emerging markets, using the iShares MSCI Emerging Markets ETF (EEM) as my benchmark. I pointed out that this sector was close, but had not quite broken out to the upside Read More
The Final Bar5d ago

Watch for Higher Lows in These Three Tech Stocks
In this edition of StockCharts TV's The Final Bar, Dave uncovers strength in SQSP using the Stochastics Oscillator and the StochRSI indicator Read More
OptionsPlay5d ago

This is the #1 Options Income Strategy You Should Master
In this exclusive interview, StockCharts' Grayson Roze sits down with Tony Zhang, Chief Strategist at OptionsPlay Read More
DecisionPoint5d ago
DP Trading Room: Bonds & Yields At An Inflection Point
Today's focus was on the current and long-term conditions of Bonds and Yields which are at an inflection point. Yields are attempting to hold onto a rising trend and Bonds are plodding along to the upside for now Read More
GoNoGo Charts5d ago

$SPY FLAGS NEW "GO" TREND IN THE FACE OF DEFENSIVE STRENGTH
Good morning and welcome to this week's Flight Path. We saw some resolution of the uncertainty in the markets this past week. Equities came out of a string of amber "Go Fish" bars to paint an aqua "Go" bar on Friday. The $SPY is a "Go" Read More
Analyzing India6d ago
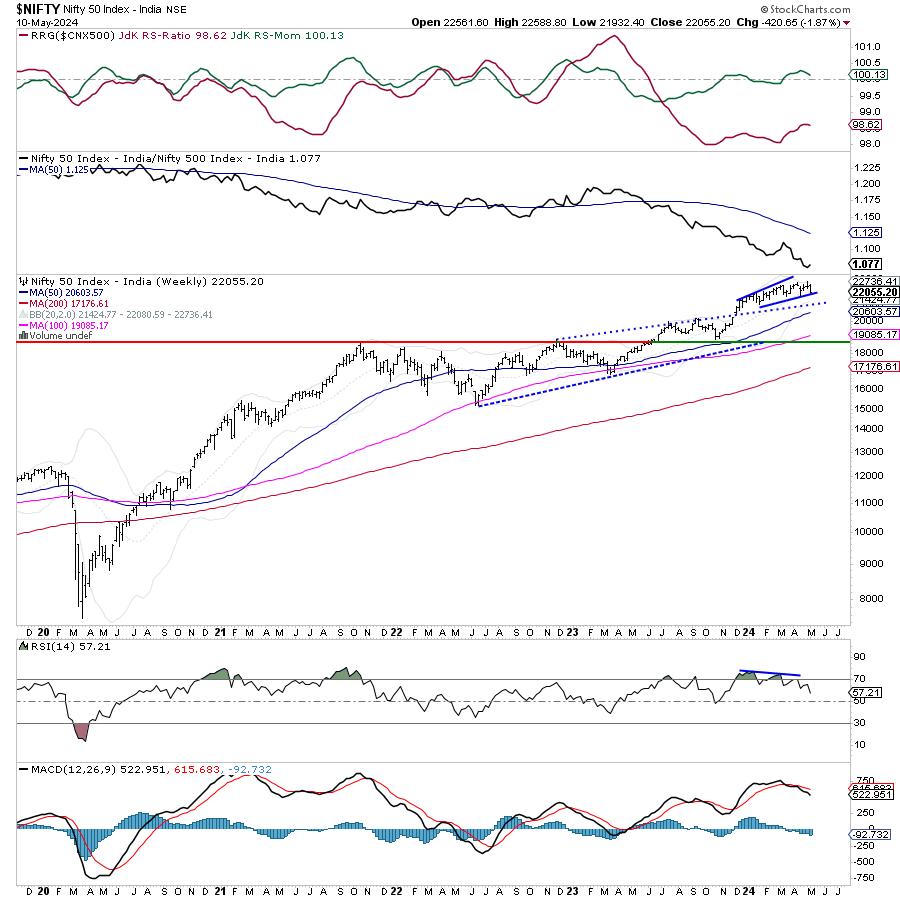
Week Ahead: Markets to Stay Tentative; This Defensive Sector May Start Showing Relative Outperformance
In the previous technical note, we had expressed concerns over the Nifty and VIX rising in the same direction simultaneously. As mentioned earlier, in such circumstances, the VIX often ends up acting as a leading indicator and a precursor to an impending corrective move Read More
GoNoGo Charts1w ago
Top 5 Stocks in "Go" Trends
Top 5 Stocks in "Go" Trends Trend Continuation on Rising Momentum GoNoGo Charts® highlight low-risk opportunities for trend participation with intuitive icons directly in the price action Read More
The MEM Edge1w ago
MEM TV: This Stealth AI Stock is Ready to EXPLODE Higher
In this episode of StockCharts TV's The MEM Edge, Mary Ellen reviews the bullish bias in the broader markets, along with the sector rotation into cyclical areas as growth areas languish Read More
The Mindful Investor1w ago
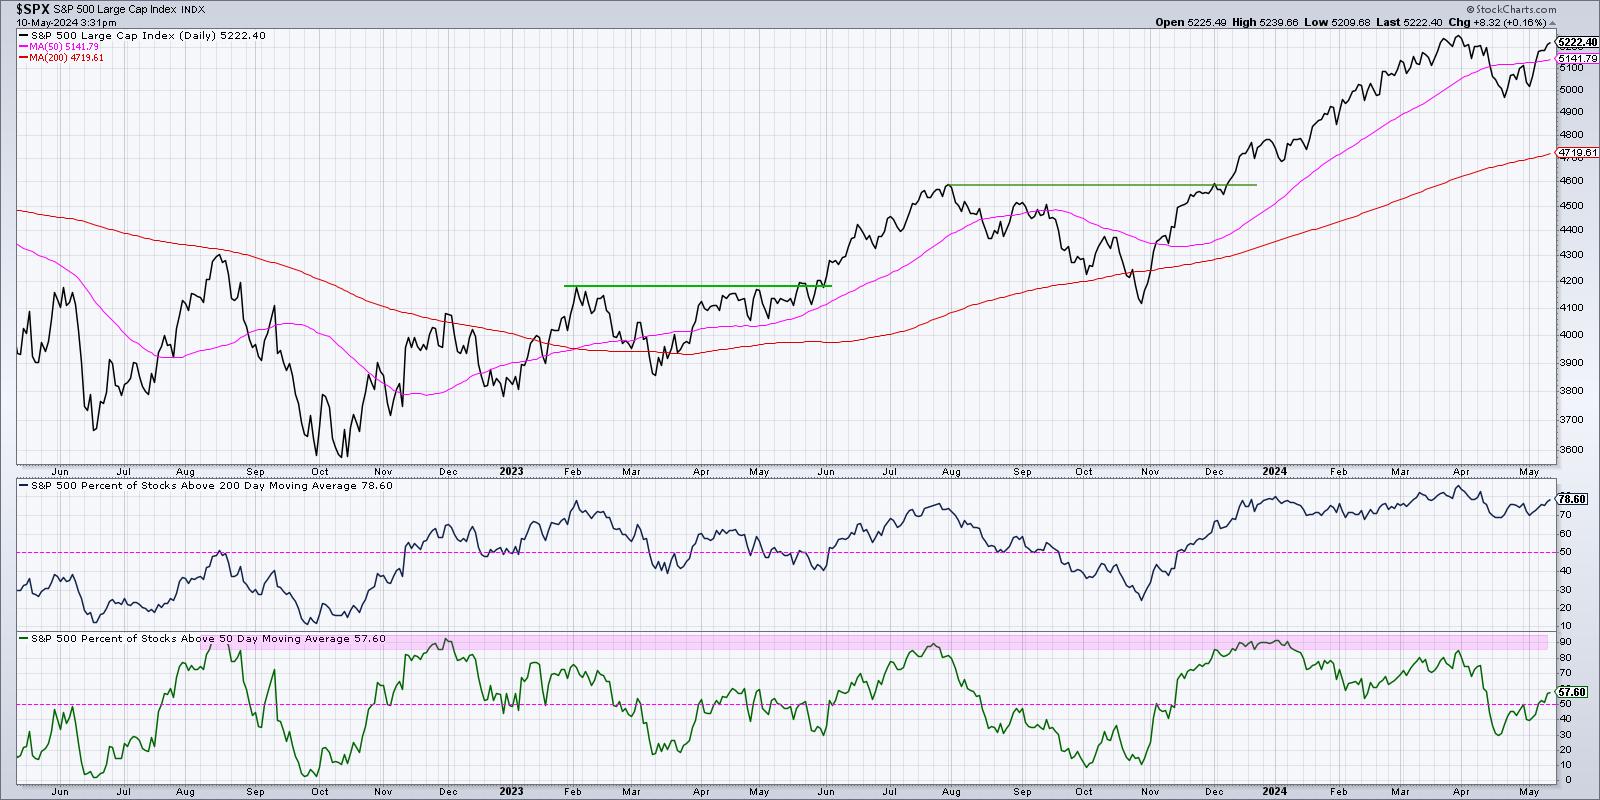
Three Breadth Indicators to Confirm a Bullish Market Trend
There's no denying the strength the major averages have displayed off their April lows. The S&P 500 finished the week within a rounding error of the previous all-time high around 5250 Read More
The Final Bar1w ago

Relative Strength Screams Bullish for This Tech Stock
In this edition of StockCharts TV's The Final Bar, Dave uncovers strength in SQSP using the Stochastics Oscillator and the StochRSI indicator Read More
Art's Charts1w ago

Six Leaders, but One Is Getting Real Frothy
After sharp declines into mid April, stocks rebounded over the last three weeks and the S&P 500 SPDR (SPY) came within 1% of its March high. This March high acts as a benchmark high that chartists can use to compare performance Read More
The Final Bar1w ago
Stocks Pop Higher as Defensive Sectors Thrive
In this edition of StockCharts TV's The Final Bar, Dave breaks down an unusual day for stocks Read More
RRG Charts1w ago
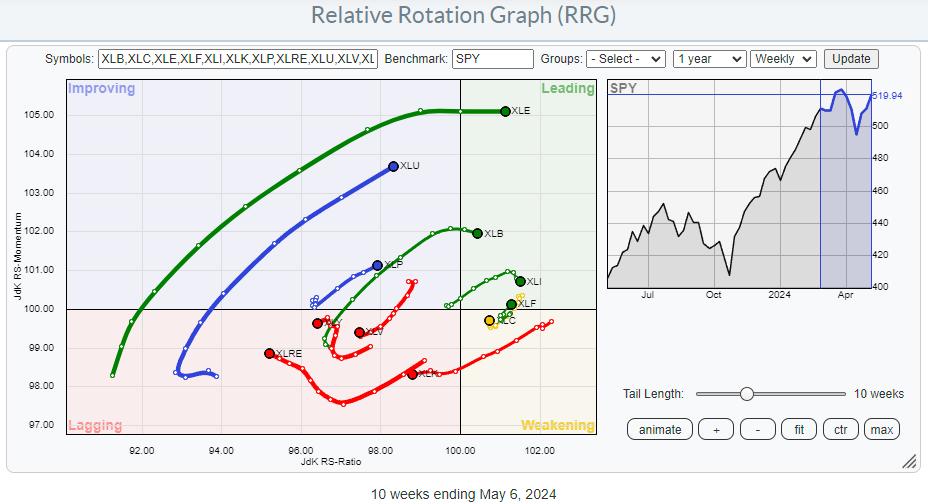
These Three Strong Financial Stocks Look Ready To Surge Higher
The Relative Rotation Graph for US sectors shows long tails for XLE and XLU. Both are on a strong RRG-Heading toward or into the leading quadrant. Also inside the leading quadrant are XLB and XLI, though they have rolled over and are starting to lose a bit of relative momentum Read More
Dancing with the Trend1w ago
Rules-Based Money Management - Part 4: Security Ranking Measures
Note to the reader: This is the twentieth in a series of articles I'm publishing here taken from my book, "Investing with the Trend." Hopefully, you will find this content useful Read More
Trading Places with Tom Bowley1w ago
This Is What I Mean By Leading Stocks In Leading Industry Groups
Sample Report A few days ago, I provided a sample of our Weekly Market Report (WMR), which is sent to our EarningsBeats.com members on Mondays. Below is a sample of our Daily Market Report (DMR), sent out to members on Tuesdays through Thursdays Read More
The Final Bar1w ago

The Top Performing Sector is Utilities?!?
In this edition of StockCharts TV's The Final Bar, Dave recaps a choppy day for equities, with utilities remaining atop the leaderboard for a second straight session Read More
DecisionPoint1w ago
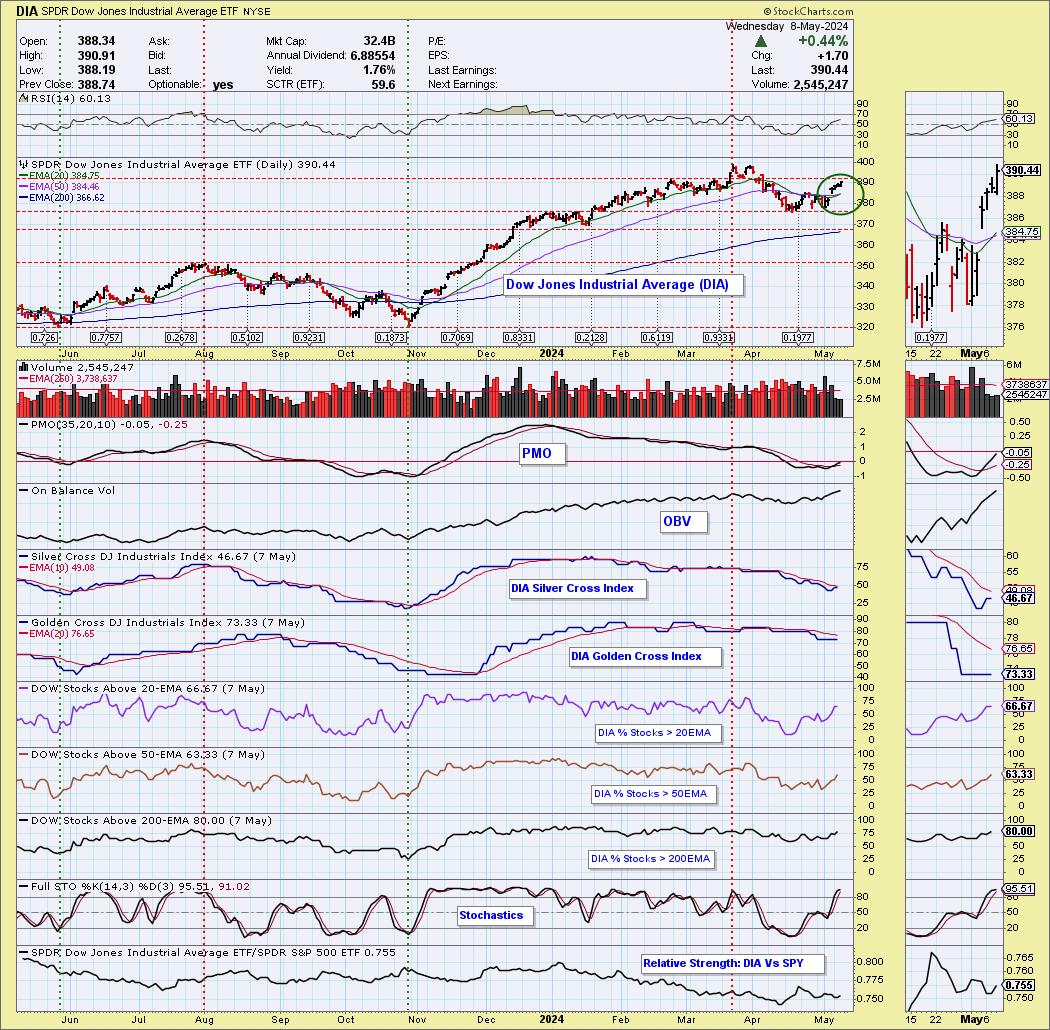
Silver Cross BUY Signals on the Dow (DIA) and Russell 2000 (IWM)
The Dow Jones Industrial Average ETF (DIA) 20-day EMA crossed up through the 50-day EMA (a Silver Cross), generating an IT Trend Model BUY Signal. The Dow saw a better rally today than the SPY, but, under the hood, it isn't quite as strong as the SPY Read More
Popular Articles
The One Chart to Watch as S&P 500 Makes New All-Time Highs
Is This the Magic Upward Break Everybody Was Waiting For?
Gold Is Doing Great!
A Grand Slam: Broader Stock Market Indexes Soar to New Highs
Bitcoin Sets Up with Classic Continuation Signal
Major Shifts Taking Place As Lower Rate Bets Increase
Get expert technical commentary delivered straight to your inbox! Sign up for our FREE weekly ChartWatchers Newsletter. Learn More
Featured Authors


Featuring a diverse collection of books, DVDs and more, The StockCharts Store has everything you need to learn more about financial charting, improve your trading systems and become a better investor.
Public ChartList Leaders


StockCharts Members unlock complete access to the Stocks & Commodities Magazine archives. Read the latest articles or browse past editions.