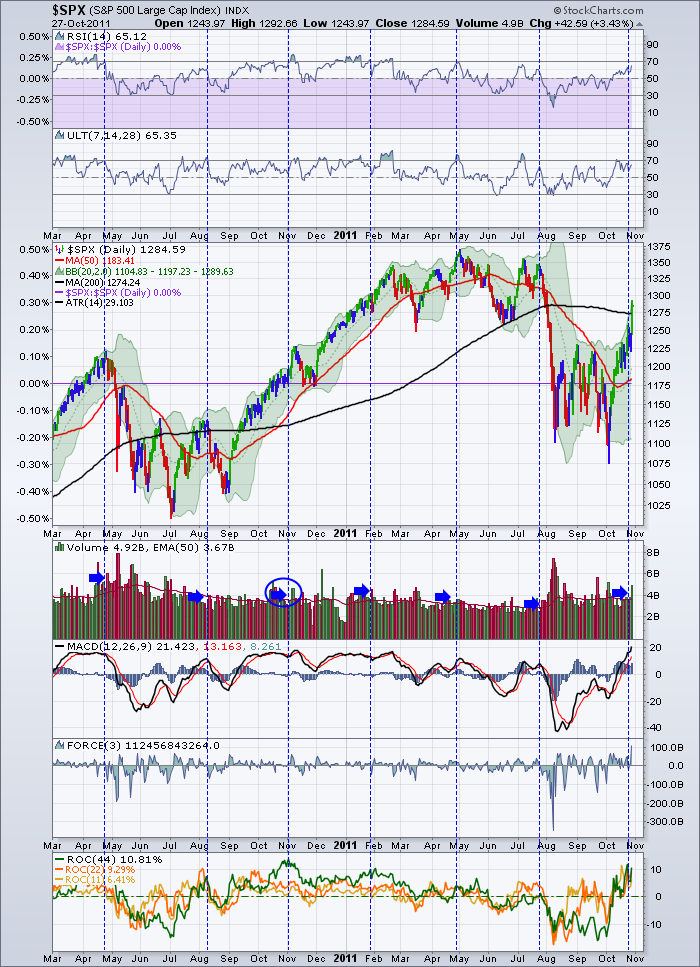
Well, that was some rally!
I float between BNN and CNBC during the trading day. Most of the time with the volume off! At the end of yesterday,with the volume on, I heard Bob Pisani enthusiastically say something about volume. Paraphrasing ~ Did you see that volume today.... it was ### billion shares. That's Big Volume.
My memory flickers and I remember Mr. Pisani ranting for a few days in a row a while back how exceptional the volume was again. Shortly after, the market turned down. How could you have so many buyers and then the market falls?
Well, let's try looking at it this way. The rally yesterday was euphoric. Were there any retail investors selling their long positions in the morning? So who was selling into the rally? A lot of selling in fact. By the end of the day 5 Billion shares traded. It can only be institutions making big moves. We are also sitting up 15 % in 18 days. Who wanted to let go of so many shares when everything looks so good? We can have up days on low volume and we can be concerned it's a sign of weakness. Or is it a sign of comfort? If the trade is going your way, and you see no reason to sell, you stay in the trade. So long up periods may be accompanied by low volume. When you have a large position in a stock, the easiest days to sell some are strong up days.
On the chart below. I marked the "above average" volume days that were significantly above the previous days AFTER earnings Options Expiration Day. The vertical dotted blue line is placed the day before. Not so you can be predictive, just so the line is out of the way so you can see what happened following. It's tiny to see on these blog screens, so click on the chart, change the size to 1600, click update and take a look.
This week, we have had 3 above average volume days out of 4. When I did this simple experiment this morning, I noticed the volume pattern around the April OE period was similar to this week, with the exception of the euphoric day like yesterday. Yesterday (October 27) was truly big volume when we remember that Citi used to trade 800 Million a day and since the split the 50 EMA volume is now only 60 million a day.
Well, it was an interesting exercise. We learn every day in the markets, and I learned something about watching volume and what happens on a low volume option expiration day. The Nasdaq had a very low volume Friday OE day. So low it was below the previous day. Maybe the big funds were comfortable. Now they are up another 5%. Are they still comfortable holding?
Lets watch what happens now after a huge high volume day after OE.
Positives:
I am enthusiastic that things might be ready to roll for a longer period, as the MACD is up in positive territory at a level where historically it can ride for a while. Look left on the chart. As well, all the rate of change indicators have made it in to positive territory. That's BULLISH! They are also at a level where they might take a breather. Look left on the chart.
Negatives:
I am cautious to the upside as a bear market rally usually stops at 65 on the RSI. Perhaps we get a 50% pullback of the move and the RSI gets supported around 40.
Italian bond auction did not go so well today. I'll keep watching those credit pieces of data.
Good Trading,
Greg Schnell, CMT

