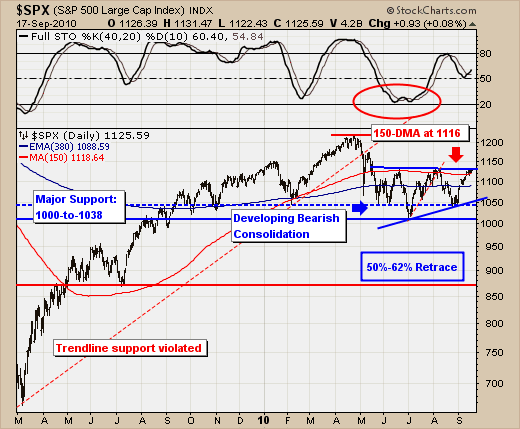
The S&P 500 is square within the September/October "historically weak" time frame, but it has been nothing short of astounding to be sure...to the upside. We've seen a rally in 10 of the past 13 days, with prices now squarely upon major previous high resistance. And we believe the counter-trend rally in all probability ended itself in the wee hours of Friday morning's overseas trade with the S&P futures breaking out above the 1131 level...and promptly failing. If Friday hadn't been the "triple witching" of options and futures (we refuse to recognize "quadruple witching" given we know of no one person of institution trading single stock futures) - then a larger decline may have indeed developed. But this very well may change next week.
As for the technicals, there are several very clear patterns: 1) the bullish "head & shoulders" bottoming pattern everyone is pointing to at this juncture; and 2) the bearish consolidation after the sharp decline off the April highs. We vote with the latter given overhead resistance and the anemic volume of this current rally, although anemic volume doesn't seem to have the same technical cache it used given the high frequency trading dominates nearly 40% of the trading volume. Still, being classical technicans, we should see the rally fail at current to slight higher levels and for a sharp decline to develop into the historical October bottom. Our target is the 50%-62% retracement zone...which equates to roughly 880-to-940.
Hence, a rather well-defined shorting opportunity has arisen, and we've elected to being the process of adding short positions. As far as this setup is concerned...they don't come much better.

