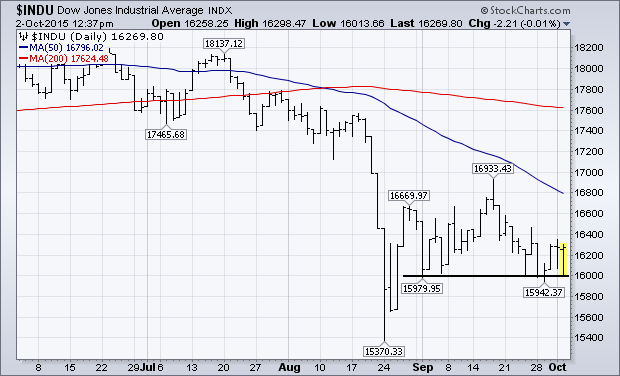
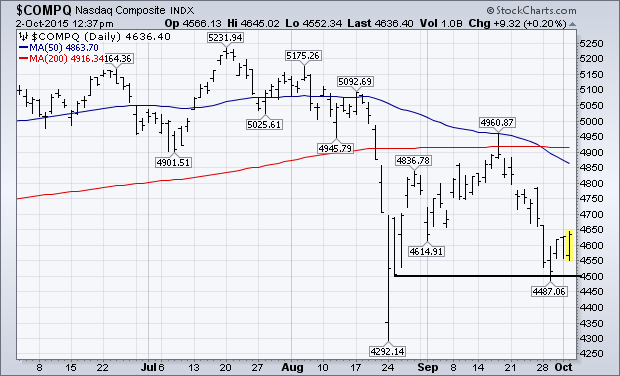
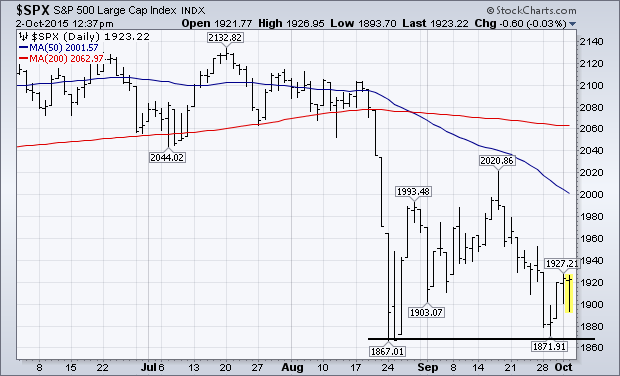
The stock market continues to test underlying support levels formed during the summer. The first chart (below) shows the Dow Industrials holding chart support along the 16,000 level. The second chart shows the Nasdaq Composite holding support along its August 25 closing low at 4500. The last chart shows the S&P 500 testing its August intra-day low. The testing process is likely to continue well into the month of October. So far, those support levels are holding. However, all three stock indexes remain below their mid-September peak and falling 50-day averages. Sooner or later, those levels will have to be exceeded if the market trend is going to improve.
- John

About the author:
John Murphy is the Chief Technical Analyst at StockCharts.com, a renowned author in the investment field and a former technical analyst for CNBC, and is considered the father of inter-market technical analysis. With over 40 years of market experience, he is the author of numerous popular works including “Technical Analysis of the Financial Markets” and “Trading with Intermarket Analysis”. Before joining StockCharts, John was the technical analyst for CNBC-TV for seven years on the popular show Tech Talk, and has authored three best-selling books on the subject: Technical Analysis of the Financial Markets, Trading with Intermarket Analysis and The Visual Investor.
Learn More