TAKEAWAYS
- The Dow Jones Industrial Average, S&P 500, and Nasdaq Composite are holding strong
- Gold and the US dollar trend higher in spite of dovish Fed comments
- Cannabis stocks trade higher on news of partial legalization in Germany

It was an action-packed week in the stock market. The FOMC decided to keep interest rates unchanged, and also indicated there could be three rate cuts this year. This gave the stock market a positive boost, and the broader indices—S&P 500 ($SPX), Dow Jones Industrial Average ($INDU), and the Nasdaq Composite ($COMPQ)—notched record highs. Although the market ended the week mixed, all broader indices were up for the week.
The US economy is growing at a solid pace, the job market remains strong, and inflation is starting to slow, which is enough to keep investors optimistic that the economy will see a soft landing rather than a recession. While Fed Chairman Powell's speech after the FOMC decision was similar to previous speeches, the biggest takeaway this time is that Powell implied an easing in labor market tightness and stabilization in inflation. If the trend continues in this direction, the FOMC will likely cut interest rates three times later this year.
Powell emphasized that inflation could return if the Fed eases too much too soon. And if interest rate cuts are implemented too late, that could also be a harmful situation. Incoming data will continue to be assessed, since there needs to be greater confidence that things are moving in the right direction before bringing down interest rates.
Interestingly, the recent inflation data, which came in higher than expected, didn't change things much. The Fed is confident that inflation will come back to 2%. This was good news for the market, and especially for the Financial sector.
The weekly chart of the Financial Select Sector SPDR ETF (XLF) rose sharply after the Fed's meeting. Even though it pulled back on Friday, XLF was up for the week. A slight pullback is healthy for something that has seen a steep ascent. The chart below shows that XLF is well above its support level at around $37.75, which is when the ETF broke out above a consolidation pattern.
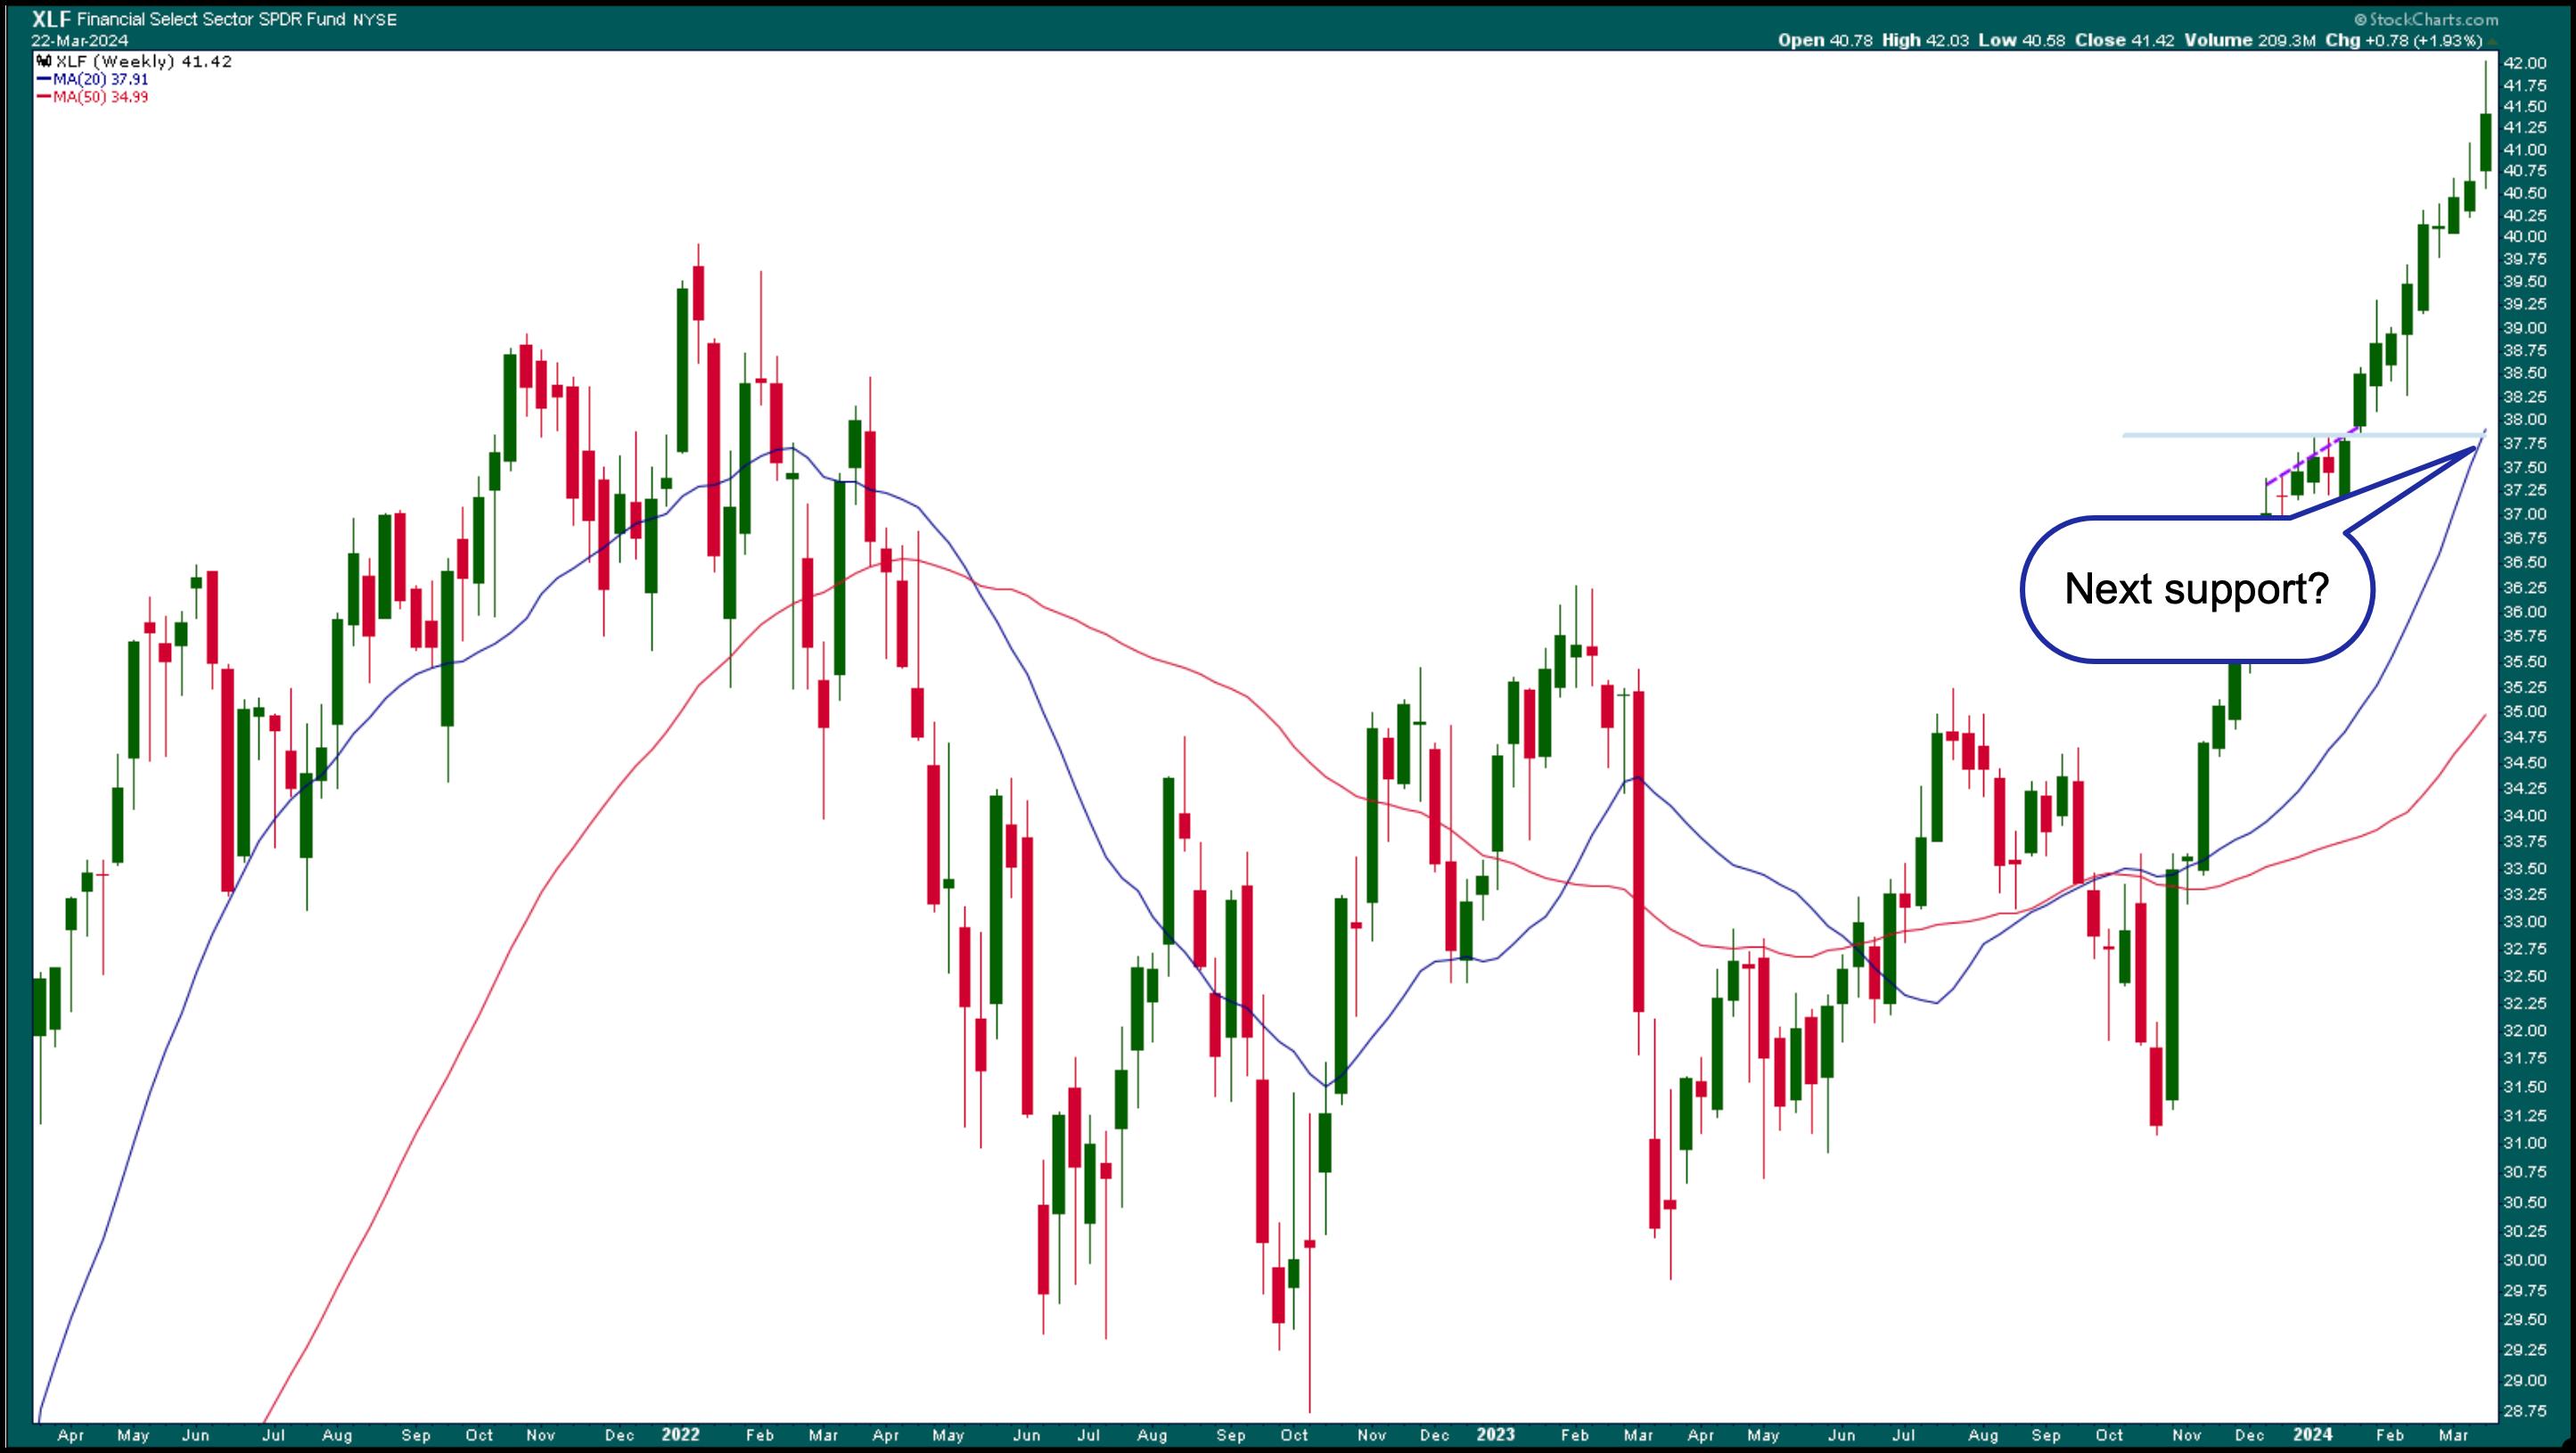
FIGURE 1. WEEKLY CHART OF FINANCIAL SELECT SECTOR SPDR ETF (XLF). The Financial sector has gained bullish traction and is trading well above its near-term support level.Chart source: StockCharts.com. For educational purposes.
It's worth adding XLF to your ChartList. If XLF pulls back further, followed by a reversal with a follow-through, then Financials could move higher, especially for the big banks. The regional banks still have some catching up—the SPDR S&P Regional Banking ETF KRE is down about 5.6% for the year. This could change once the Fed starts cutting interest rates. Small businesses will apply for loans, and demand for mortgage and auto loans could increase.
Viewing a PerfChart of the S&P 500, XLF, and KRE over one year reveals some interesting data points. Financials have marginally outperformed the S&P 500, and regional banks still have much catching up to do.
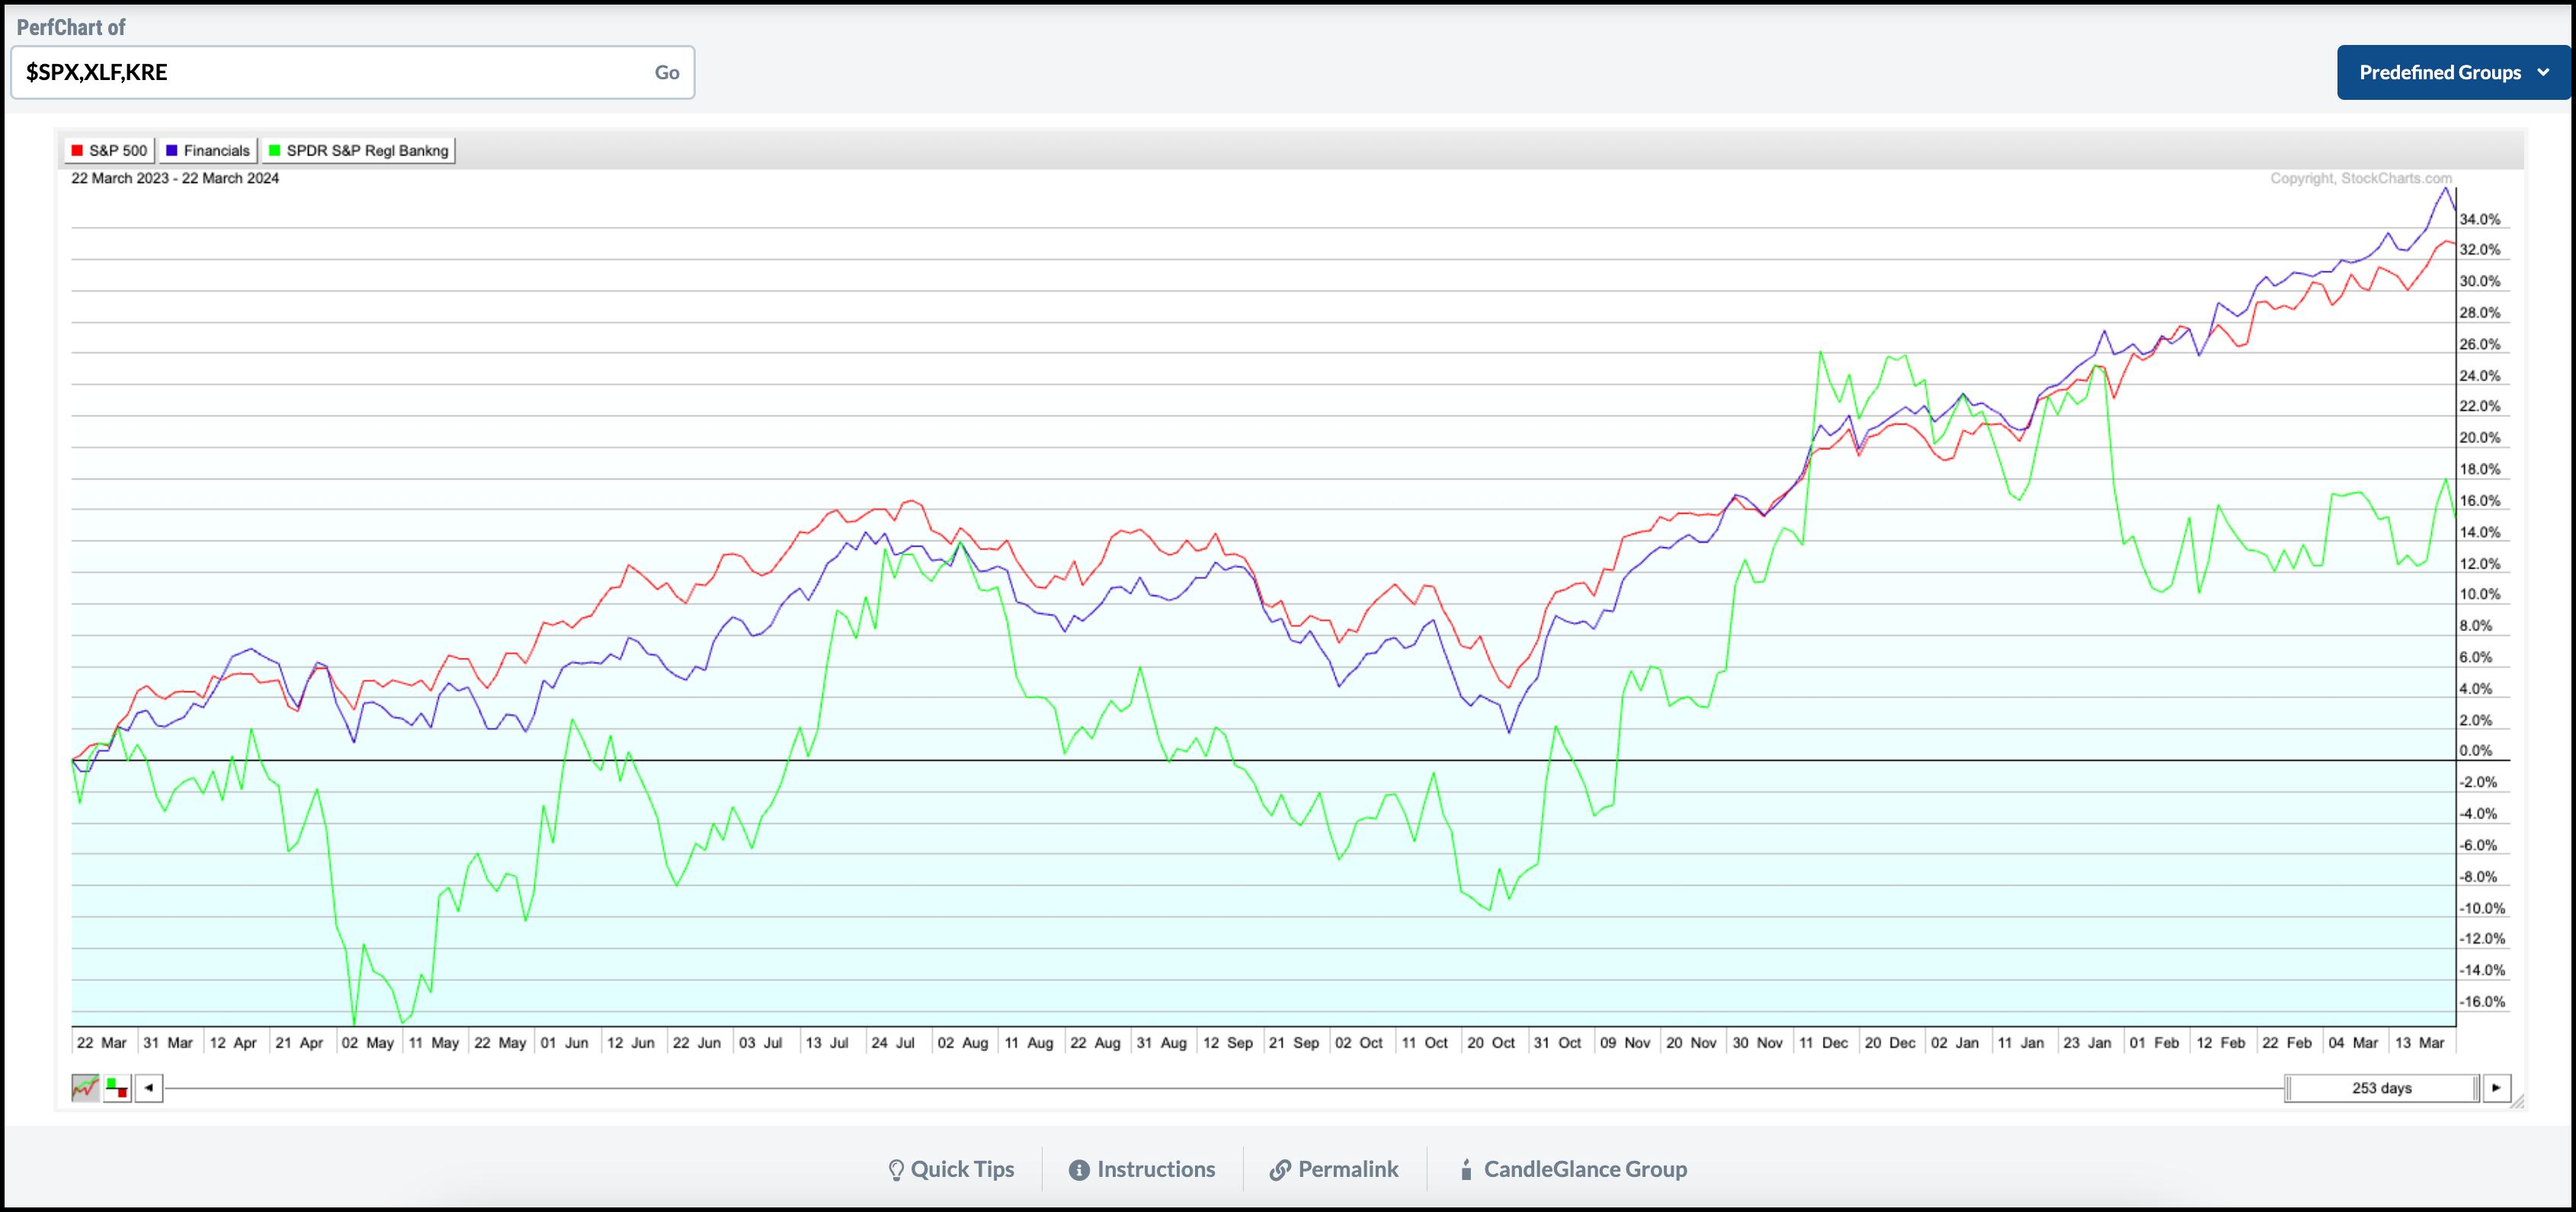
CHART 2. PERFCHART OF S&P 500, XLF, AND KRE. Financials have marginally outperformed the performance of the S&P 500 in the last year. Regional banks are at around 16% over one year.Chart source: StockCharts.com. For educational purposes.
How to View a PerfChart
- From Your Dashboard, click on the Charts & Tools tab.
- In the PerfCharts card, enter symbols $SPX, XLF, KRE
- Hit return.
The US Dollar and Gold
Besides the Fed, central banks worldwide also seemed to be more dovish. This was reflected in the US dollar action. On Friday, the US Dollar Index ($USD) gained strength as it approached its short-term resistance of 104.60.
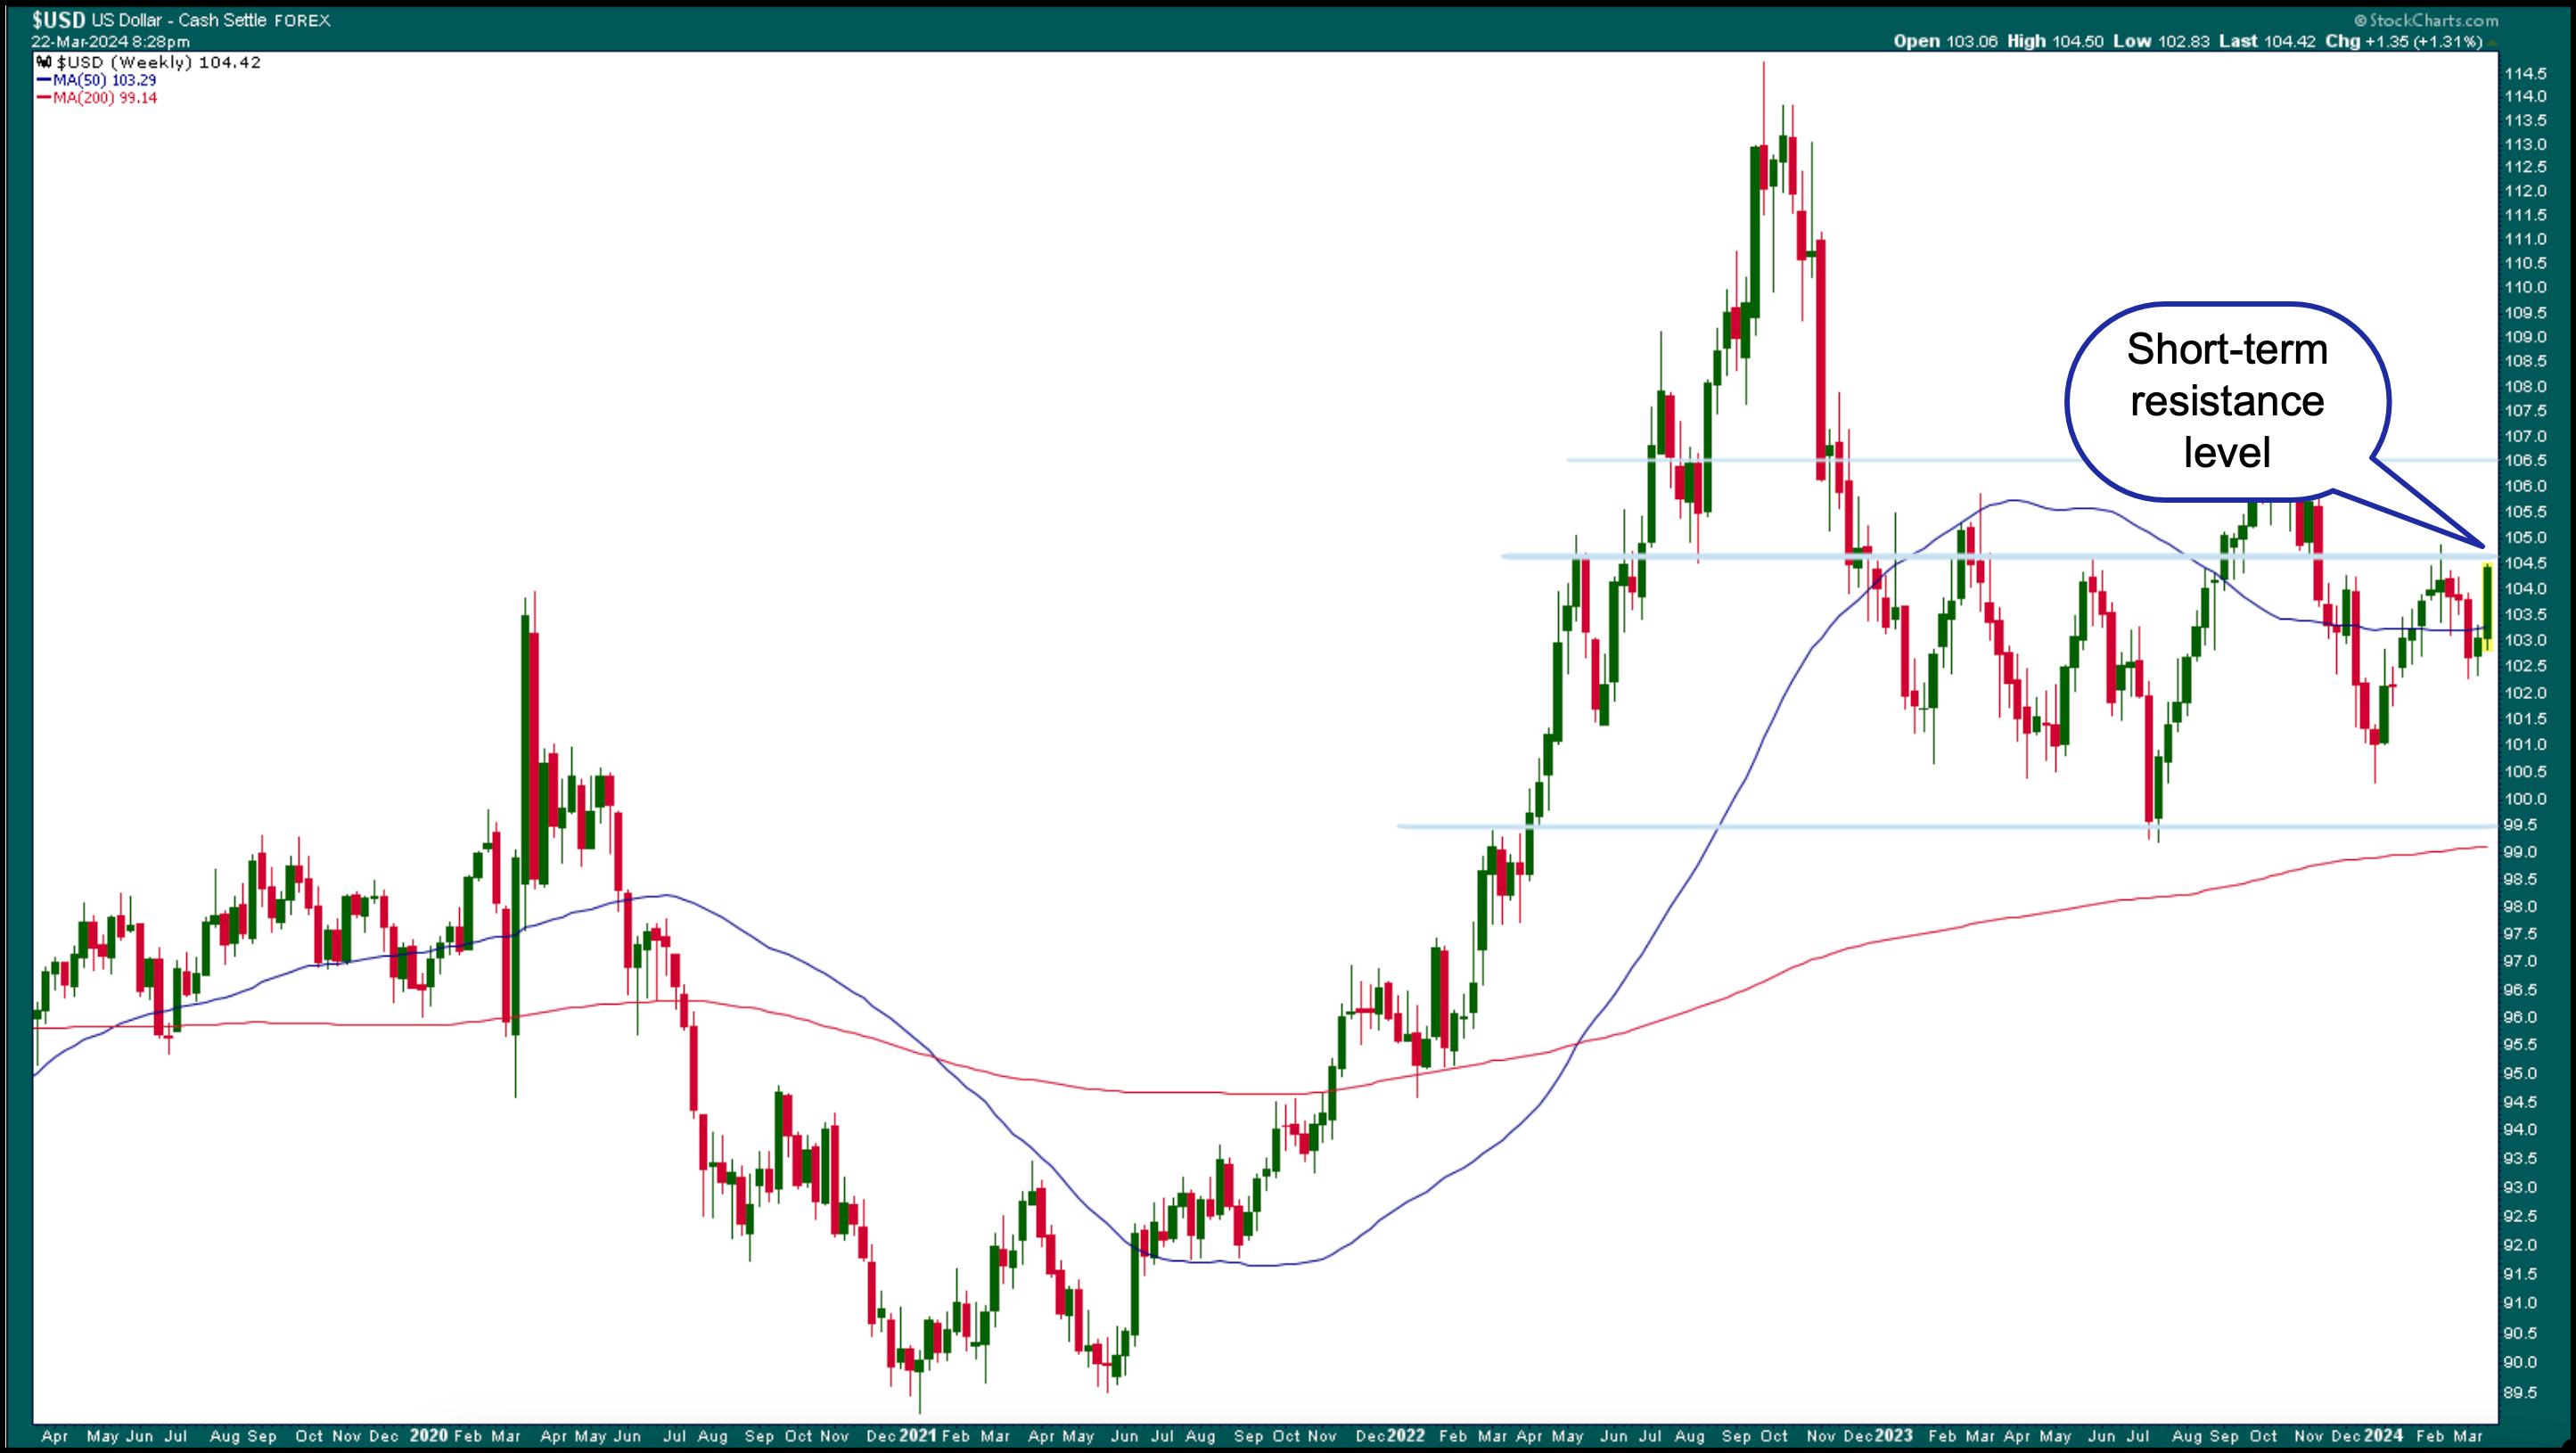
CHART 3. WEEKLY CHART OF THE US DOLLAR. The US dollar edged higher, coming close to its short-term resistance level.Chart source: StockCharts.com. For educational purposes.
A breakout above this level could take it to its next resistance level at around 106.50. If $USD breaks above this level, it could hit its 113–114 level. But the likelihood of the US dollar continuing to move higher could be low once the Fed starts to cut rates. That's when you'll need to watch the support level at 99.5 level.
Gold has also been trading higher. After moving sideways for the past few years, the price of the shiny metal broke out above its trading range and hit an all-time high of $2225.30 per ounce on Thursday (see monthly chart of gold futures below).
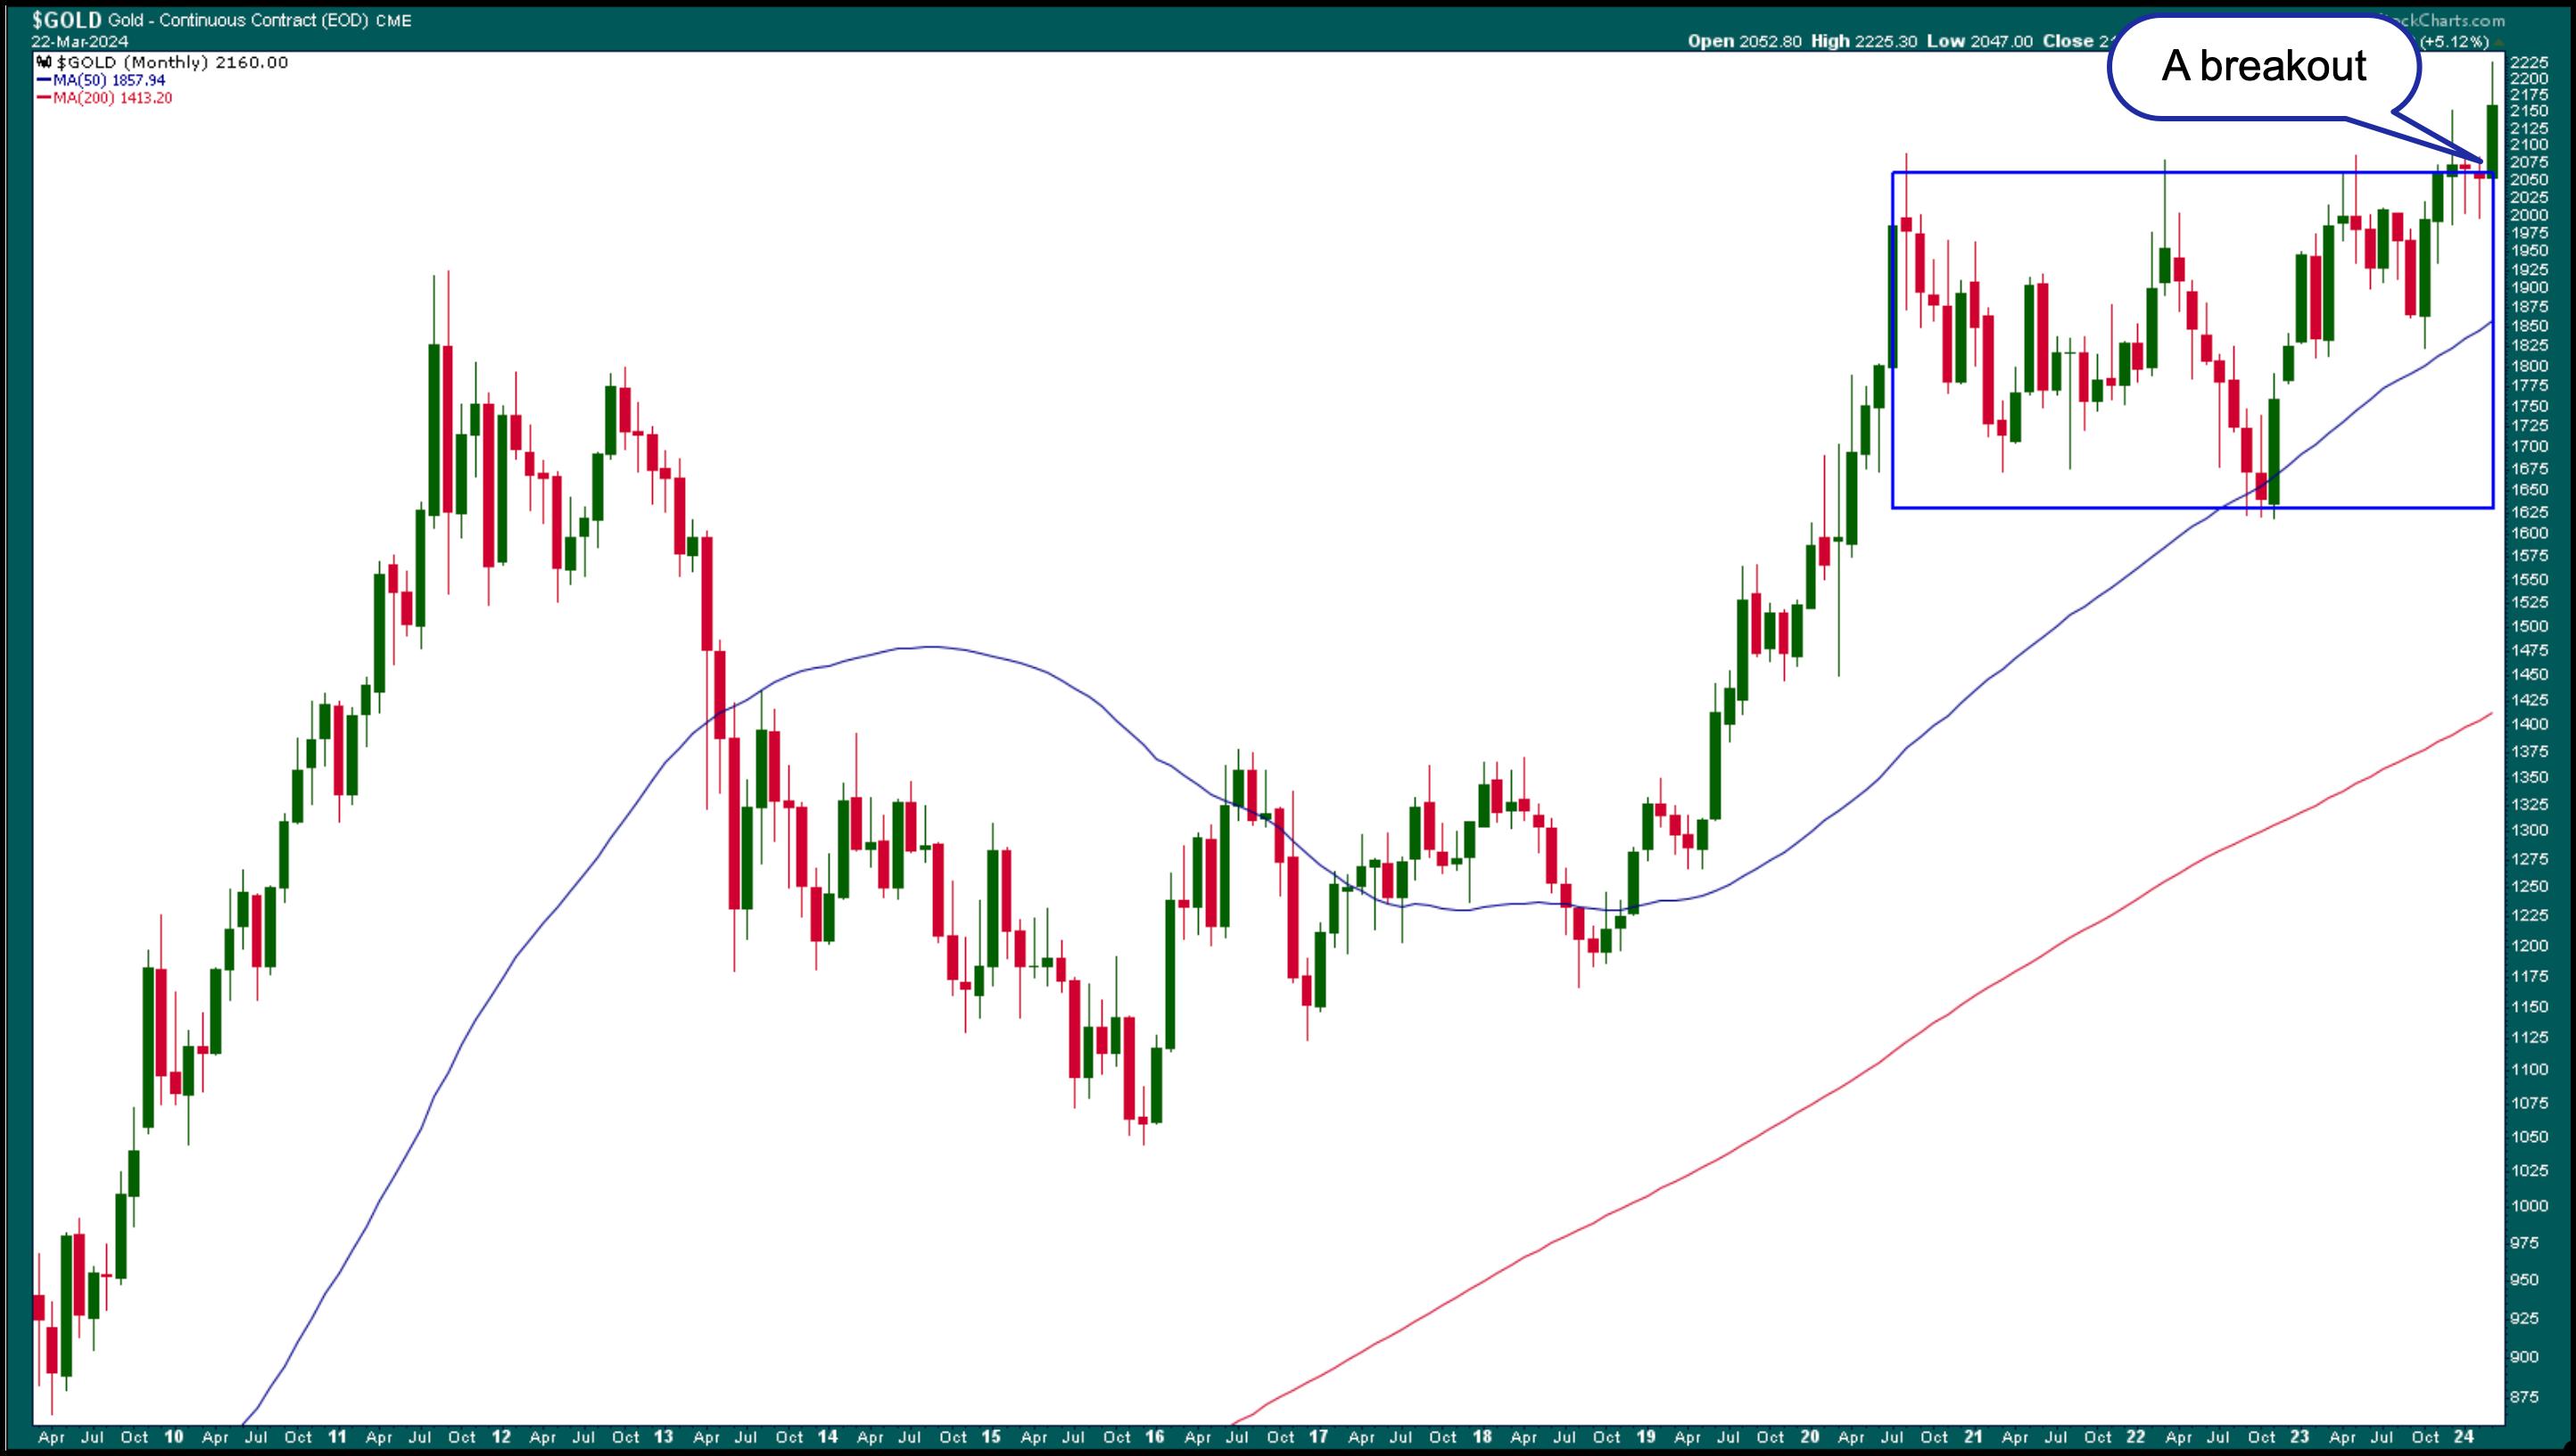
CHART 4. MONTHLY CHART OF GOLD FUTURES. Gold futures broke out of a sideways pattern and hit an all-time high.Chart source: StockCharts.com. For educational purposes.
Rising gold prices go against the idea of inflation stabilizing, which could be why gold prices pulled back to around $2164 on Friday. But it's still above its $2150 support level (see daily chart of $GOLD below). It remains to be seen if gold prices will fall below support. If they do, the next support level is well below prevailing levels. We're talking $2028 levels.
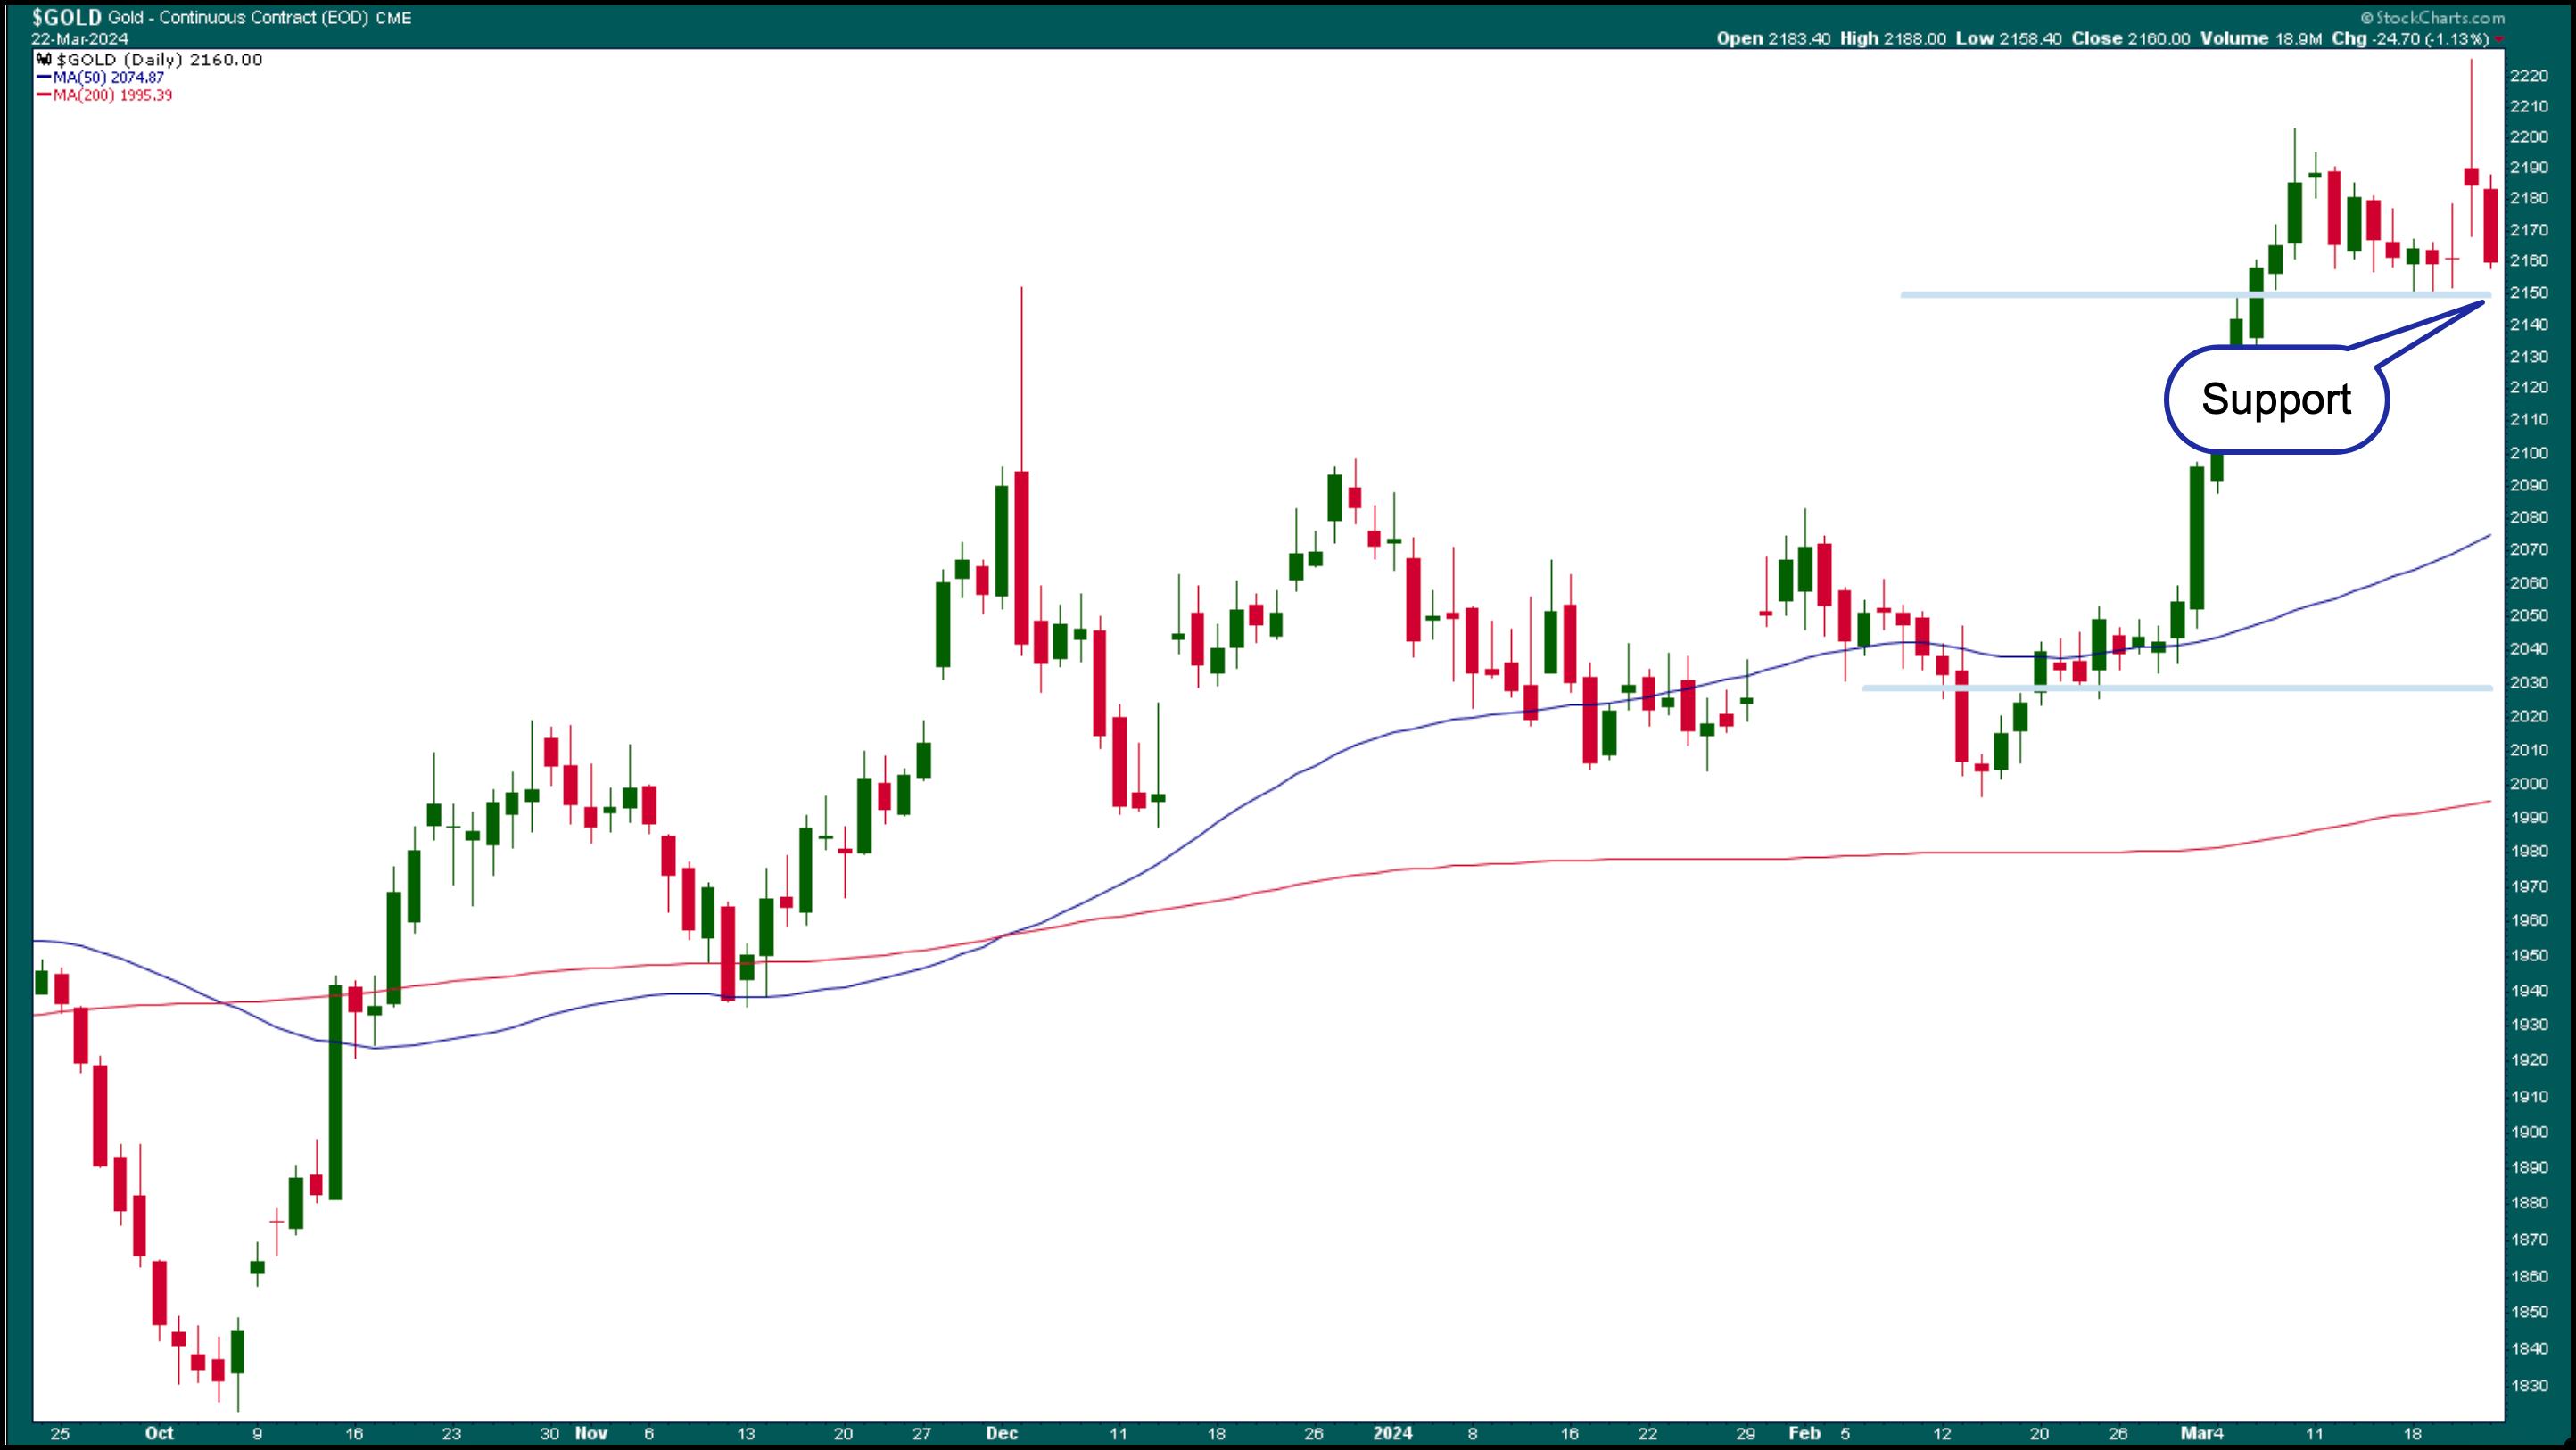
CHART 5. DAILY CHART OF GOLD FUTURES. Gold prices pulled back, but are still above near-term support.Chart source: StockCharts.com. For educational purposes.
In Other News
Bitcoin had a pretty volatile week. After hitting a high of 73,802.64, $BTCUSD retreated over 13% to close at 63890.87.
Cannabis stocks moved higher on the heels of partial legalization of cannabis in Germany that's expected to go into effect on April 1. Shares of Aurora Cannabis (ACB), Canopy Growth (CGC), Tilray (TLRY), and Cronos Group (CRON) all soared on Friday.
The Bottom Line

That said, equity markets are still strong, with the uptrend intact. The positive news is that the rally is spread out across a broader spectrum of the market instead of a concentration in a handful of tech stocks. The CBOE Volatility Index ($VIX) is trading slightly above 13, indicating that investors continue to be complacent.
Next week will be a short trading week, since the stock and bond markets are closed on Good Friday. There are some key economic data to watch for next week, but, given recent Fed remarks, they may not move the stock market much unless the data is drastically different than expected.
End-of-Week Wrap-Up
- S&P 500 closes down 0.14% at 5,234.18, Dow Jones Industrial Average down 0.77% at 39,475.90; Nasdaq Composite up 0.16% at 16,428.82
- $VIX up 1.16% at 13.07
- Best performing sector for the week: Communications Services
- Worst performing sector for the week: Real Estate
- Top 5 Large Cap SCTR stocks: MicroStrategy Inc. (MSTR); Super Micro Computer, Inc. (SMCI); Coinbase Global Inc. (COIN); Veritiv Holdings, LLC (VRT); Williams Sonoma (WSM)
On the Radar Next Week
- March Consumer Confidence
- February New Home Sales
- January S&P/Case-Shiller Home Price
- February PCE Price Index
- Fed Chair Powell speech
- Fed speeches by Waller, Bostic, and Cook
- March Chicago PMI
Disclaimer: This blog is for educational purposes only and should not be construed as financial advice. The ideas and strategies should never be used without first assessing your own personal and financial situation, or without consulting a financial professional.
Happy charting!
