TAKEAWAYS
- Dow Jones Industrial Average, S&P 500, and Nasdaq Composite dropped
- Gold keeps hitting new highs
- The VIX spiked above 18 but closed at 17.31
Now that earnings season has begun, what can you expect the stock market to do, especially after its stellar Q1 run? Well, after a few months singing the monotone "up, up, up" tune, the stock market has mixed things up a little. Now you hear "up, down, up, down."
Why the Change?
A hotter-than-expected CPI number sent the stock market into a selling frenzy, but the PPI, which came in slightly lower than estimates, reversed things slightly. However, the selling pressure returned on Friday, with the broader indexes closing lower.
Earnings season kicked off with JPMorgan Chase (JPM), Wells Fargo (WFC), and Citigroup (C) beating estimates. Yet their share prices fell, mainly due to lower-than-expected interest income. The CEO of JPMorgan Chase, Jamie Dimon, made comments concerning inflation further worried investors. In addition, the elevated concerns of geopolitical tensions made investors jittery, resulting in the selloff the stock market witnessed this week. The CBOE Volatility Index ($VIX), considered a fear gauge, spiked above 18 during the trading day, but closed at a lower level.
Dow Jones Industrial Average Analysis
The daily chart of the Dow Jones Industrial Average ($INDU) below shows the index retreating after hitting a high in April, at around the same level as the high in March. This reversal happened relatively quickly. In this scenario, it helps to sit back, analyze the chart, and add your lines in the sand.
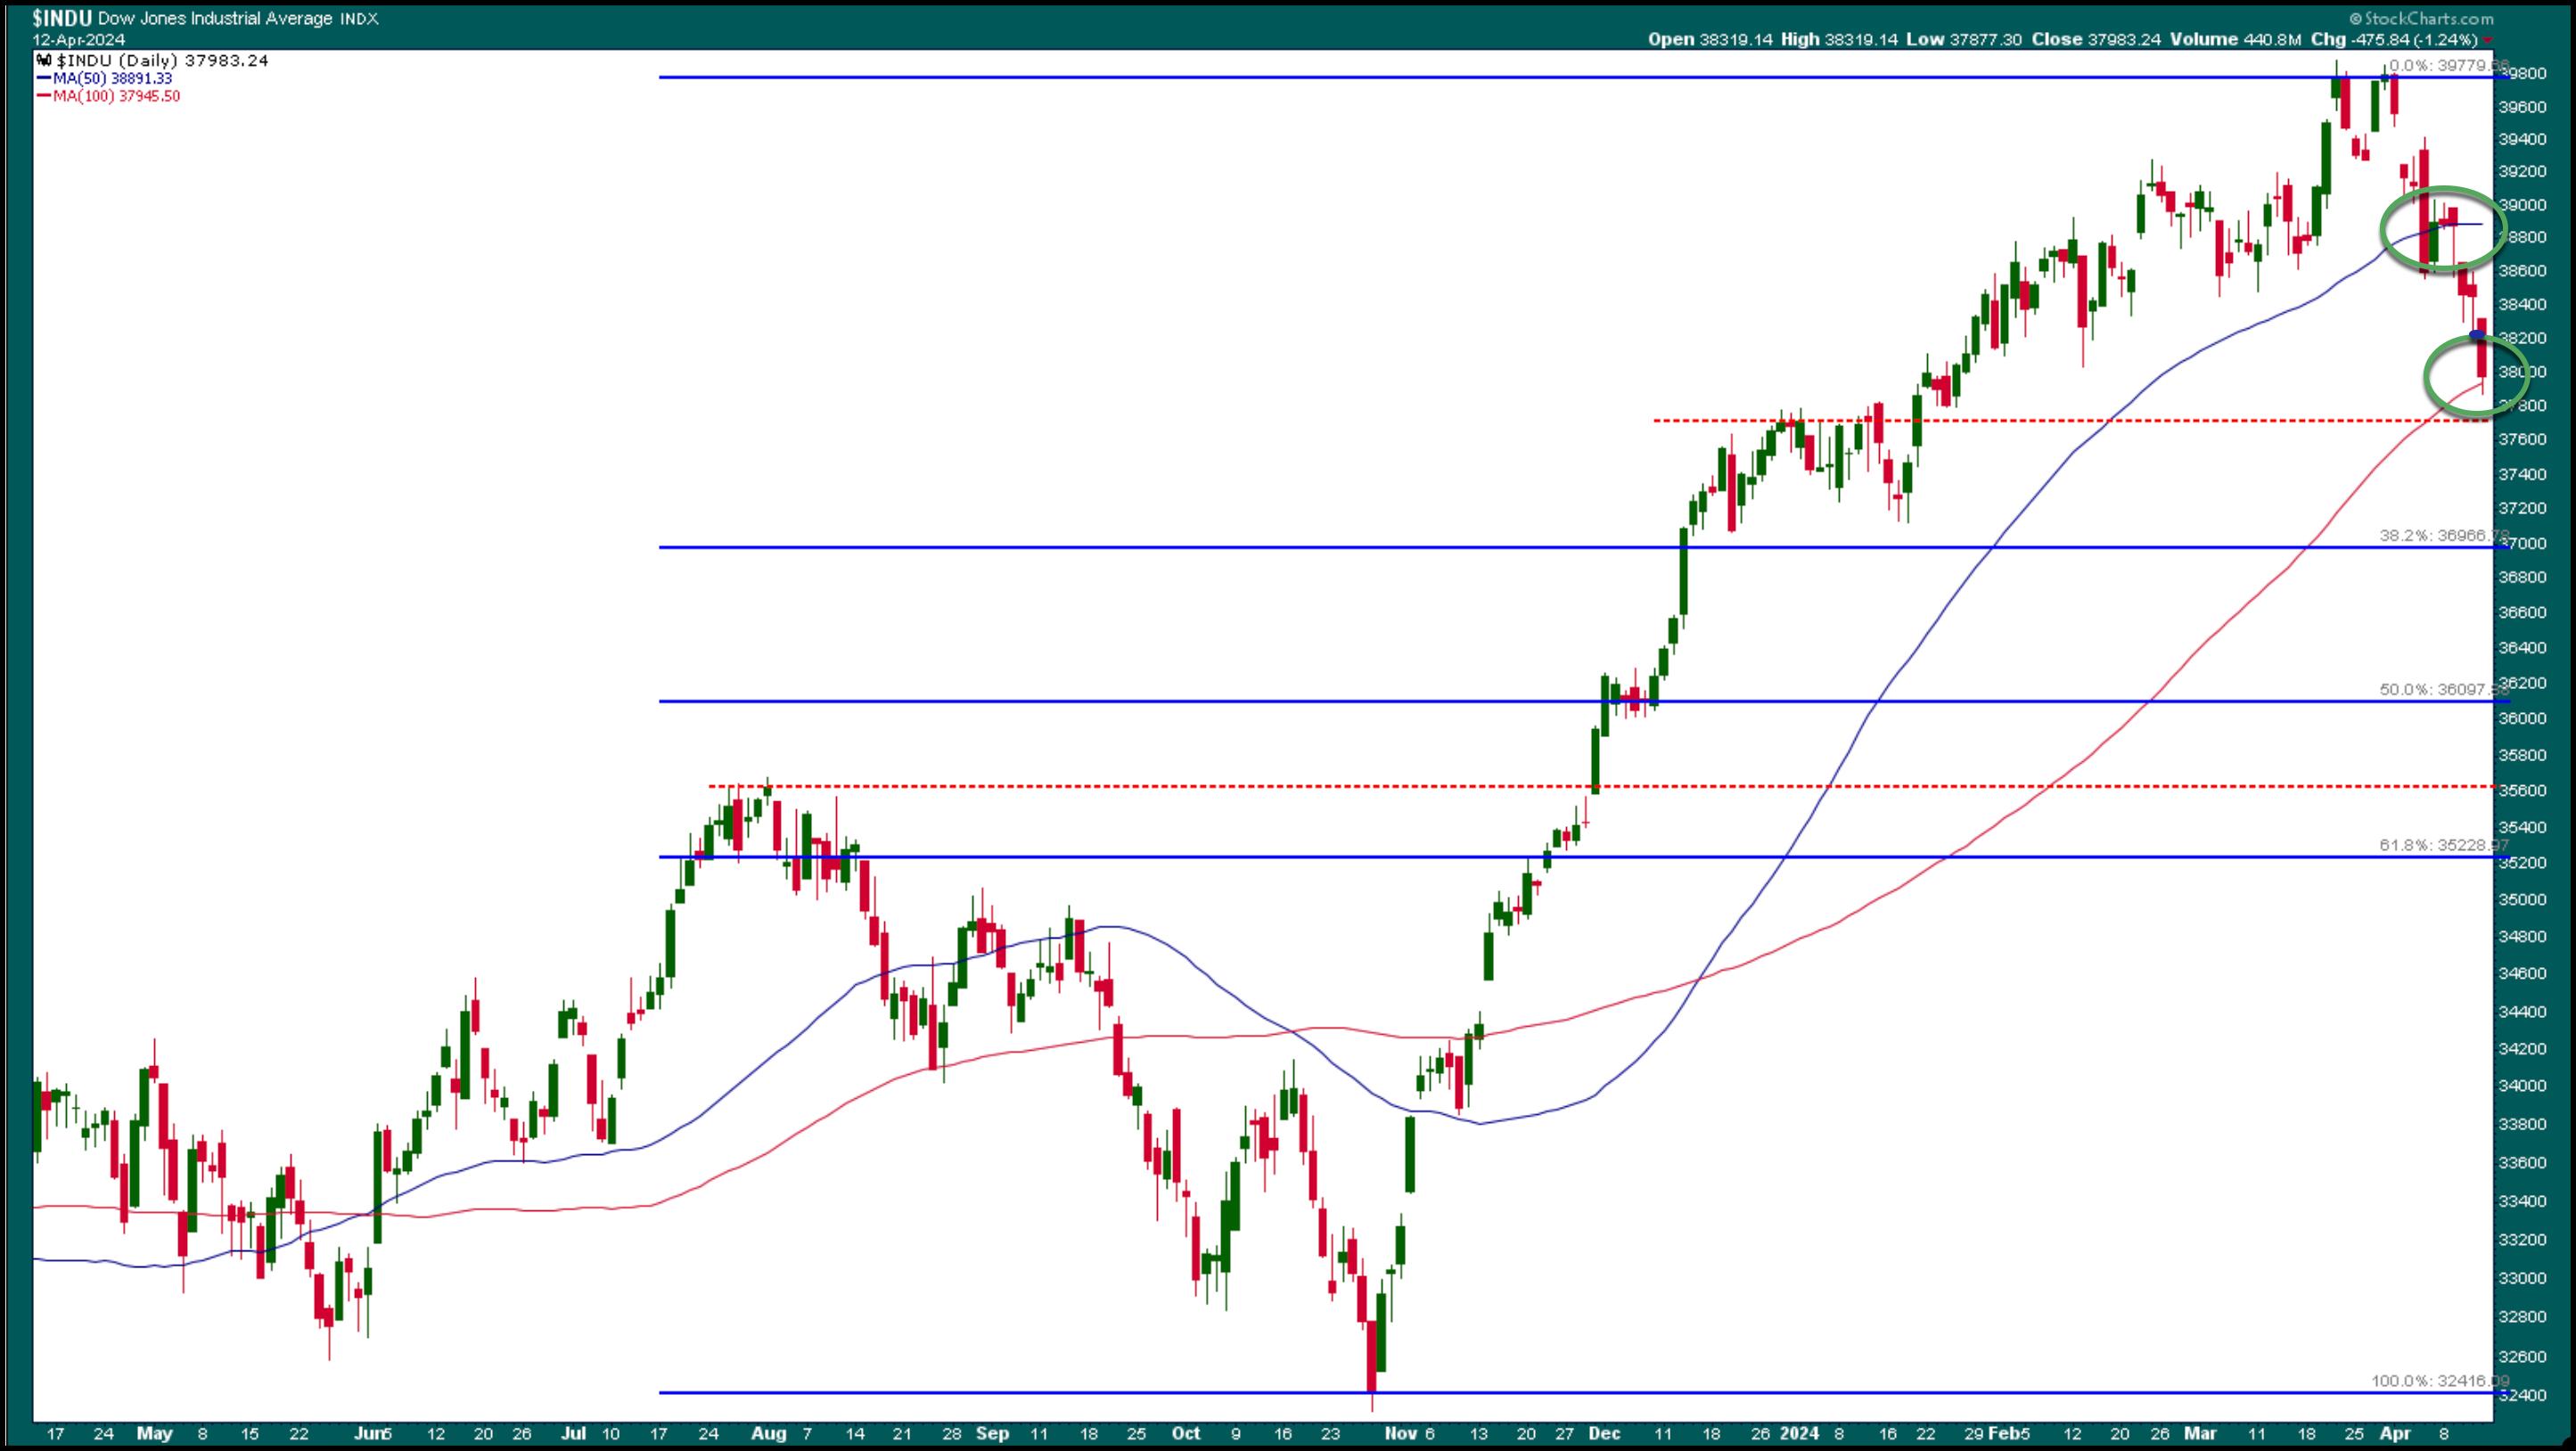
CHART 1. DAILY CHART OF THE DOW JONES INDUSTRIAL AVERAGE. After hitting a high, the index pulled back, fell below its 50-day simple moving average (SMA), and is now close to its 100-day SMA.Chart source: StockCharts.com. For educational purposes.
First, look for stand-out support levels—previous highs, price gaps, and lows. In the above chart, it's clear the series of higher highs was broken, and the index now displays lower highs.
After breaking below its February low, the next support level would be the late December high (red-dashed line). Similarly, you can identify various support levels and draw them in your chart (red dashed line at around 35,600).
Another way to identify support and resistance is to add Fibonacci retracement levels. In the daily chart of $INDU, Fibonacci retracement levels were drawn from the October low to the March/April high.
How do you add trendlines in StockCharts?
- Select the Annotate button > Line tools icon > Trendline.
- Watch this tutorial!
How do you add Fibonacci retracement levels in StockCharts?
- Select the Annotate button > Line Study icon > Fibonacci Retracement
Moving averages help identify the overall trend. In the daily chart of $INDU, the index is below its 50-day simple moving average (SMA) and is trying to hold on to the support of its 100-day SMA. The S&P 500 is at its 50-day SMA.
A Longer-Term Perspective
The weekly Dow Jones chart gives a big-picture view of the index (see chart below). While the Dow is still above its 50-week SMA, the last two weeks have seen a significant selloff. But it's less than a 5% correction. Next week should be interesting, with the S&P 500 and Dow Jones at critical support levels at the end of this trading week. The market has gone through some minor dips lately, but, if the indexes fall below significant support levels, the correction could be extended.
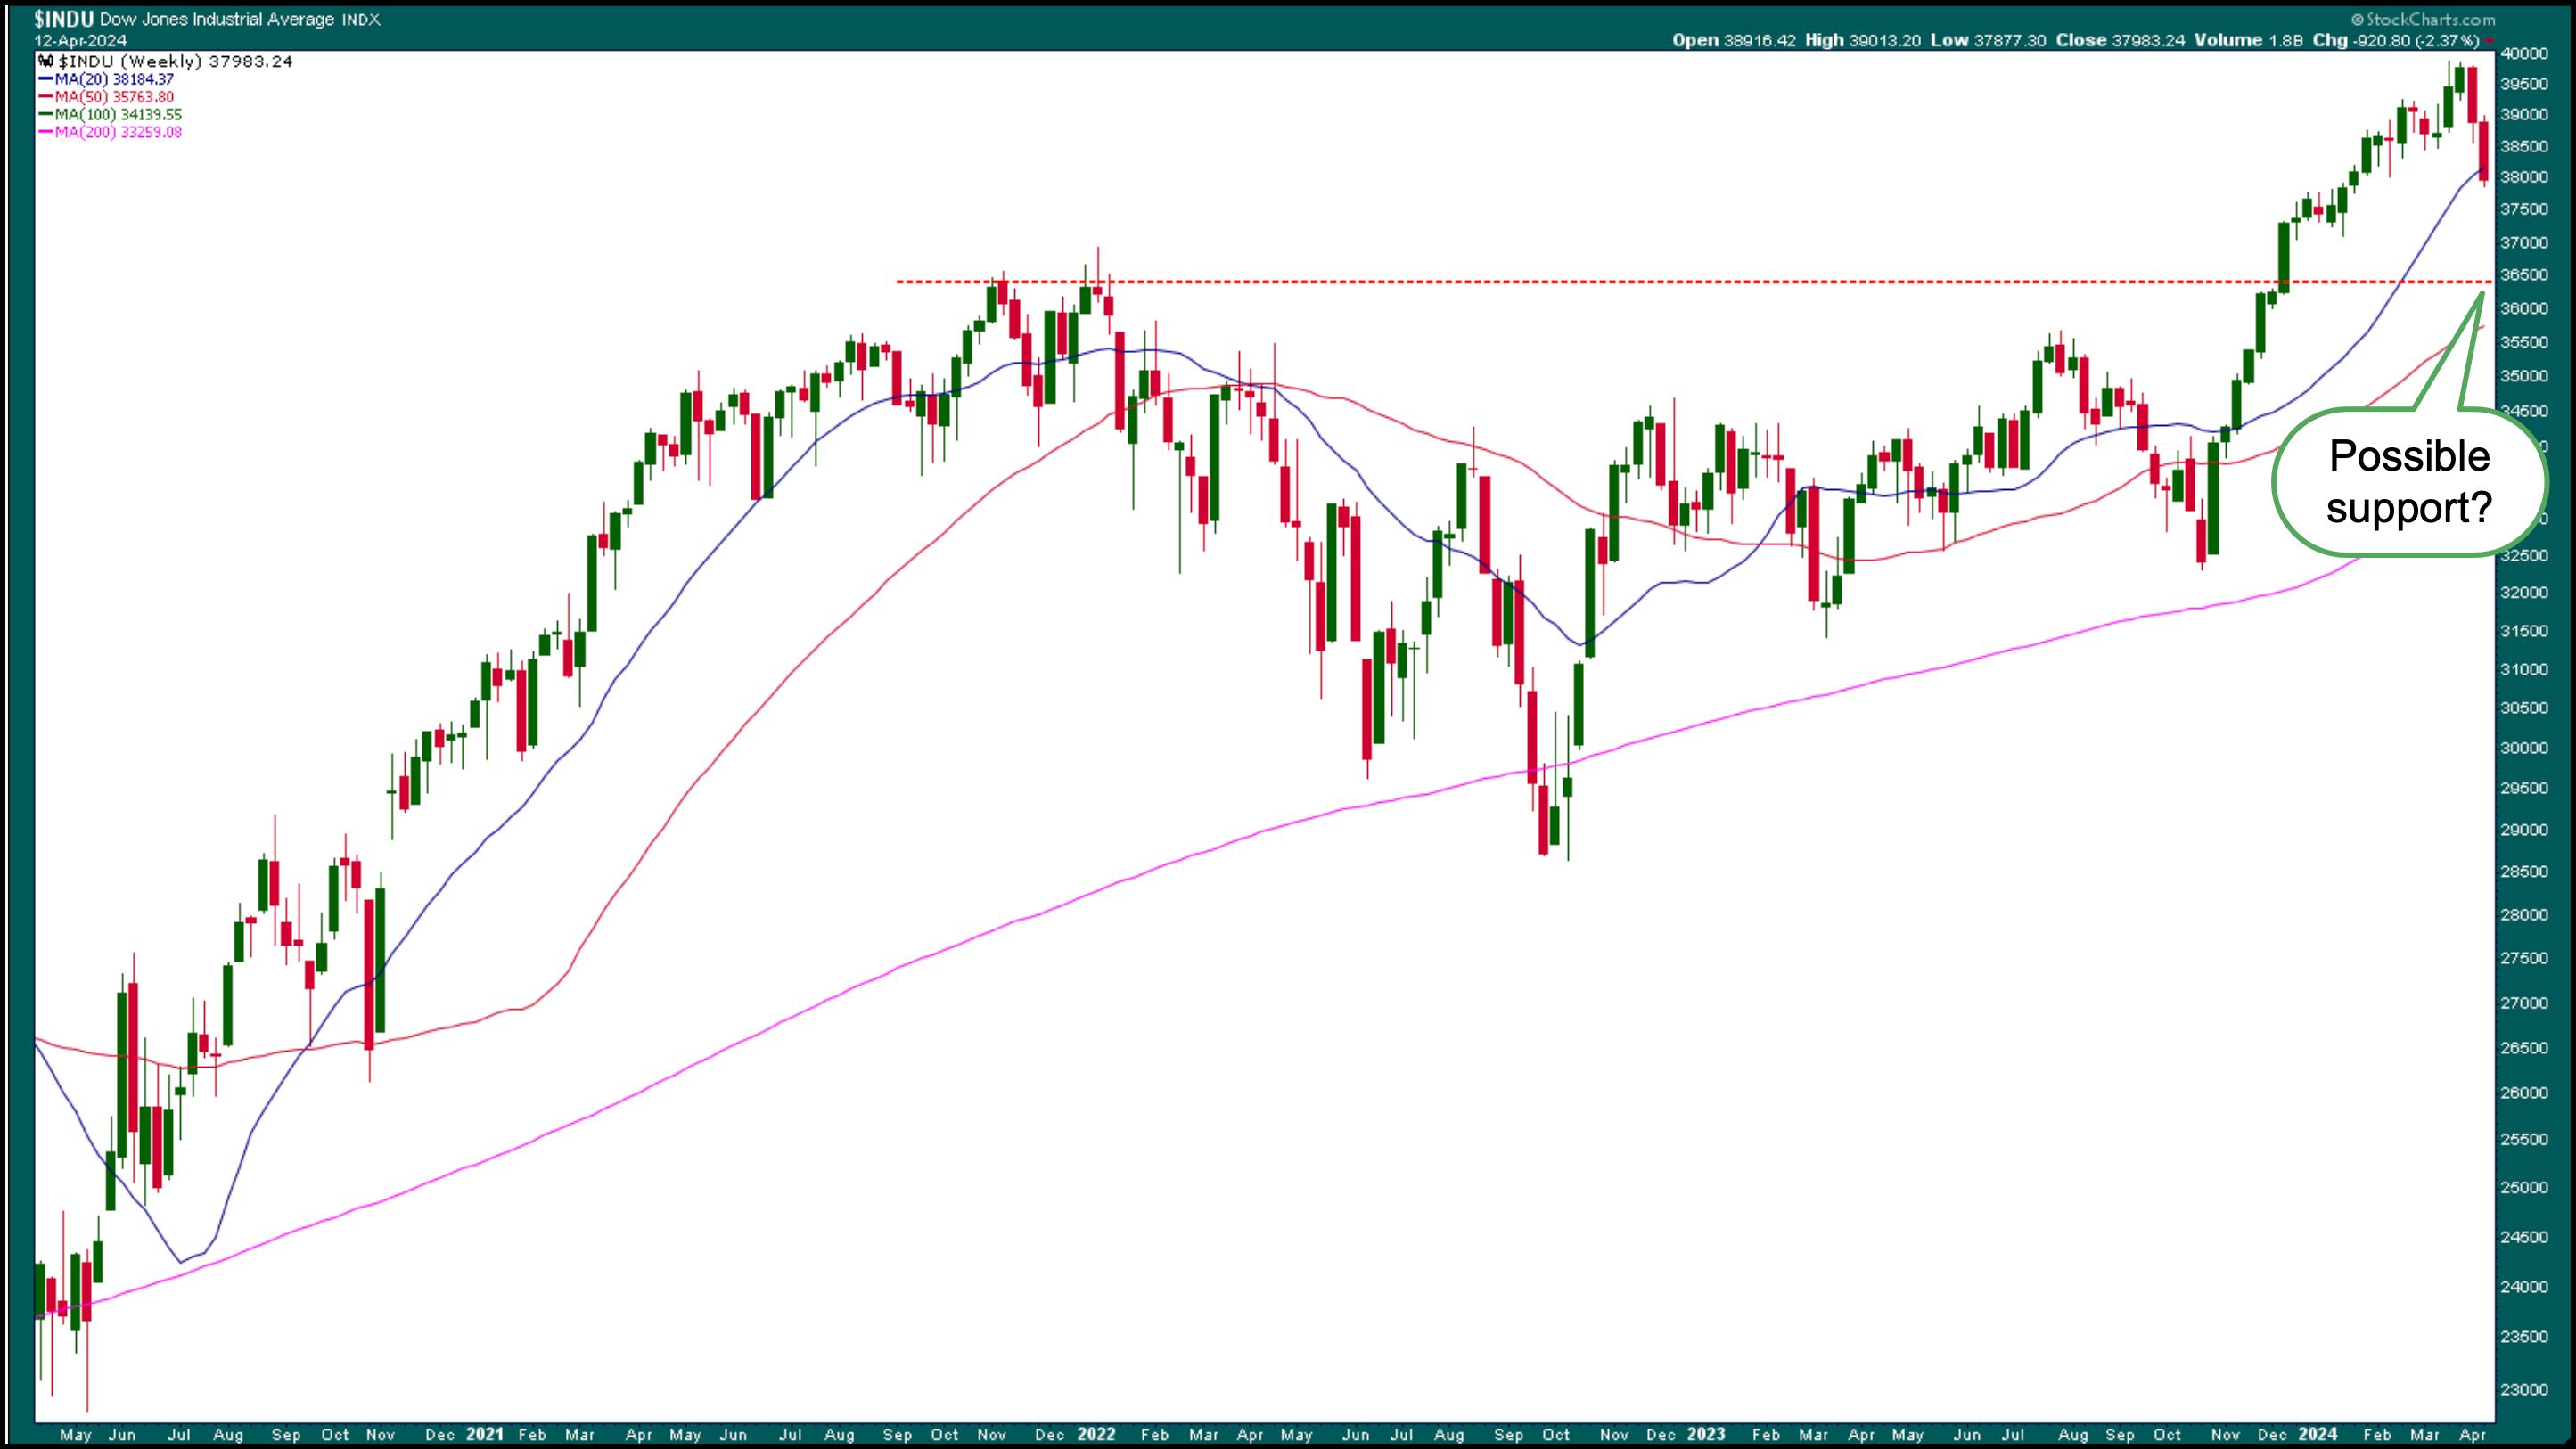
CHART 2. WEEKLY CHART OF DOW JONES INDUSTRIAL AVERAGE. The index is below its 50-week SMA. Will it fall to its next support level?Chart source: StockCharts.com. For educational purposes.
While stocks have been selling off, commodities have risen since March, with gold hitting all-time highs and silver hitting a 52-week high. Energy prices have been rising, and the US dollar is edging higher. It's too early to tell if investor sentiment is shifting, but it's something to monitor closely.
What This Means For Your Investment Portfolio
A 5–10% correction isn't something you should panic about. The stock market is overextended, and a pullback is long overdue. At times like this, you need to watch the market regularly.
A few actions you can take are as follows:
- Add potential support levels to your charts and monitor them closely.
- Watch the S&P sectors and look to see which sectors are leading and lagging. Our Chief Market Strategist, David Keller, CMT, covers this in his show The Final Bar.
- Monitor price action in the commodity markets—gold, silver, and crude oil.
End-of-Week Wrap-Up
- S&P 500 closes down 1.46% at 5,123.41, Dow Jones Industrial Average down 1.24% at 37,983; Nasdaq Composite down 1.62% at 16,175.09
- $VIX up 16.10% at 17.31
- Best performing sector for the week: Technology
- Worst performing sector for the week: Financial
- Top 5 Large Cap SCTR stocks: MicroStrategy Inc. (MSTR); Coinbase Global Inc. (COIN); Super Micro Computer, Inc. (SMCI); Vistra Energy Corp. (VST); Vertiv Holdings (VRT)
On the Radar Next Week
- March Industrial Production
- March Manufacturing Production
- More Fed speeches
- Earnings from Goldman Sachs (GS), Bank of America (BAC), Morgan Stanley (MS), United Airlines (UAL), and Schlumberger (SLB)
Disclaimer: This blog is for educational purposes only and should not be construed as financial advice. The ideas and strategies should never be used without first assessing your own personal and financial situation, or without consulting a financial professional.
Happy charting!