Investors in energy continue to find more downside pressure.
The monthly chart for Natural Gas has been broken. Currently, the chart continues to press the bottom right-hand corner.
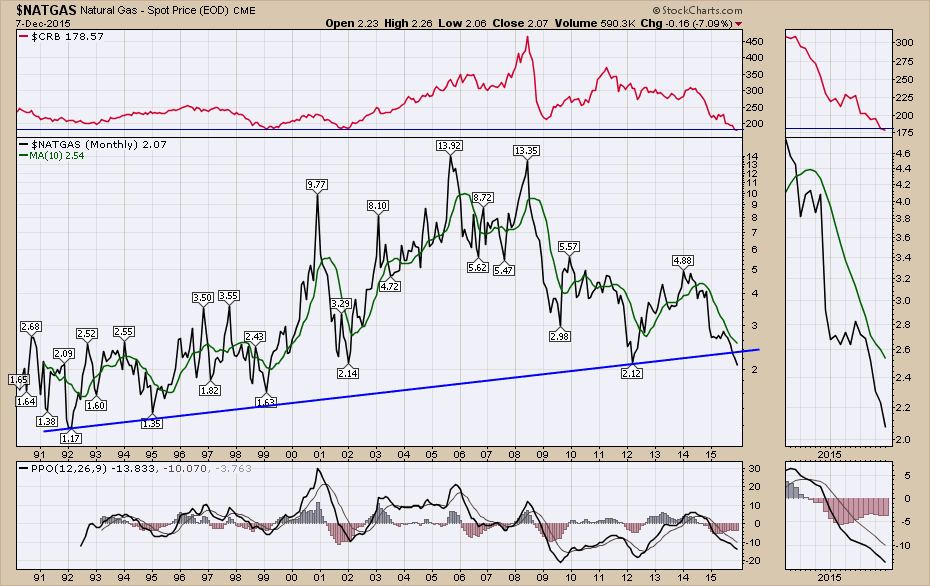
The 10-month moving average is at $2.54, which is a dramatic change from the ~$4.00 level of 2014.
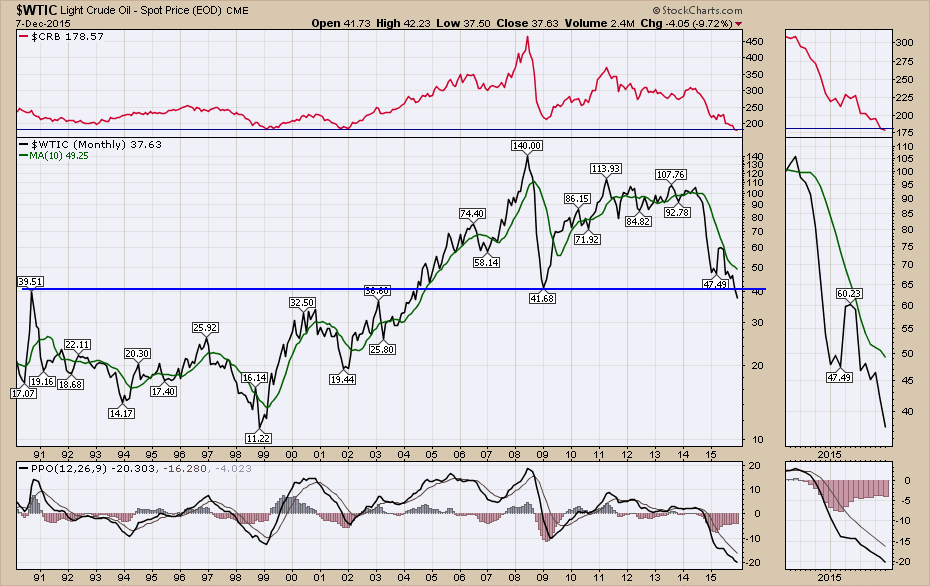
Crude Oil broke to fresh new 52 week lows today as well. It also snaps the last month end point of support from 2009. We are early in the month, but the fact that we are seeing trendlines continuing to break down everywhere has to be considered a problem.
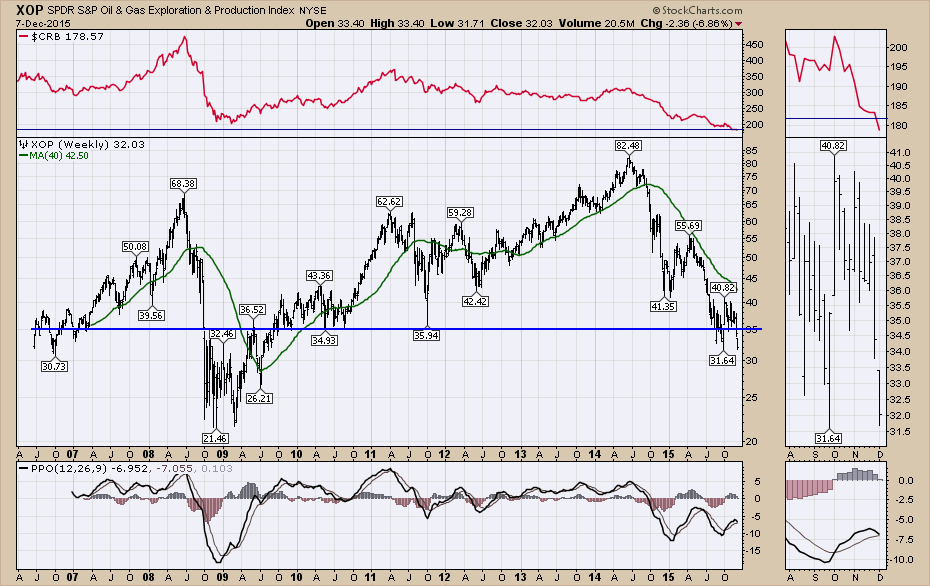
The Energy Exploration and production ETF (XOP) let go as well. This chart broke below the long-term support resistance line again. This was the resistance in the 2009 lows and support for the 2010 rally. It had a few weeks below in 2015 but for most of the 4th quarter we have been above $35.
I have covered off the asset writedowns that are coming for the exploration companies. At the end of the year, the reserves audit shows how much oil and gas can be produced at current prices. They can use different indicators like futures values, 12-month moving average or realized prices or some combination. The bottom line is all of the companies will be looking at major writedowns in the size of the company assets because they can only use reservoirs they can produce profitably at these calculated levels.
Here is a chart of Chesapeake. You can see the stock has dropped 50% from mid-November as they try to sell assets to raise cash.
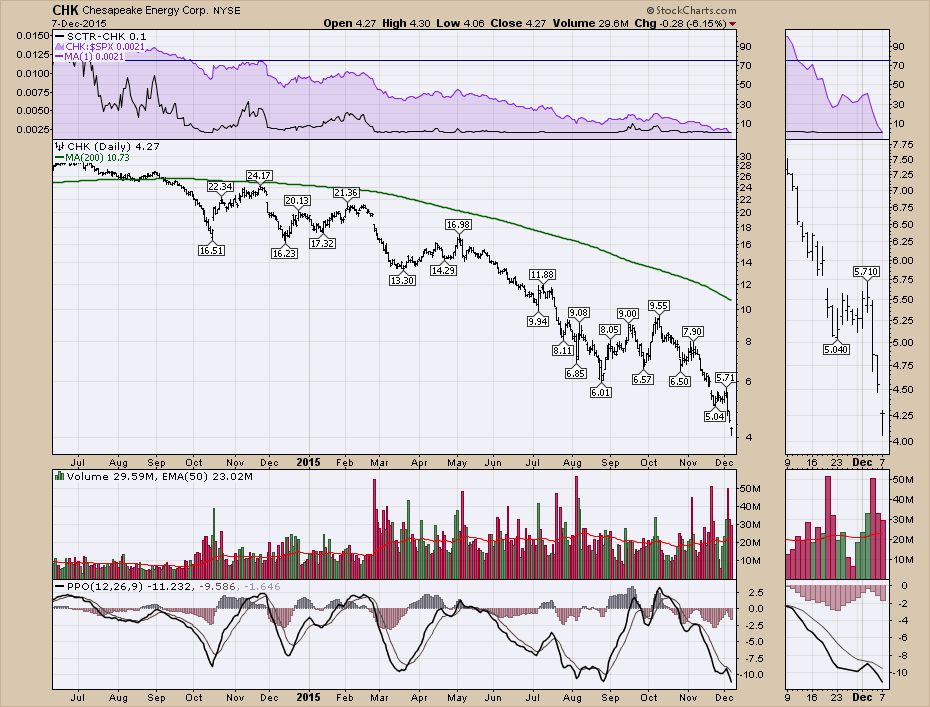
There are a lot of impaired balance sheets and debt ratios that are getting off-side as the prices continue to weaken.
On the top 2 charts, I put a red line at the 40-year lows in commodity prices ($CRB) when oil was well below the levels we closed at today. Now that oil is also plummeting as well as Natural Gas, these reserve calculations are going to make it very difficult for companies to raise money or sell properties. The $CRB made a huge move today below previous lows. This 40-year low in commodity prices has probably got a problem debt component to it and companies will be challenged to remain whole.
I have two webinars this week. One on Tuesday at 5 EST. This will focus on Canada, but I will be covering off a major portion on energy as the $TSX looks to drop below long-term support at 13000. The Canadian Technician 20151208. The second webinar will be held on Thursday at 5 EST. I will be discussing the major breakdown in the commodities, not just energy. Commodities Countdown 20151210. I have also been updating twitter so follow @schnellinvestor for individual chart ideas. Click on the yes button below to get these Commodity Countdown articles in your email.
Good trading,
Greg Schnell, CMT
