This article details the domino effect from the Energy Sector collapse as it rolled to other industries and sectors. As the problem continues on in time, it also continues to dramatically impair more industry groups and sectors. I think this series of charts serves to illustrate how tenuous the current market position is. I used ETF's to show how the investor in actual trades might have been affected. The red line shows the highest week on the chart. The charts are in chronological order as the industry groups made their final highs. All charts have the same dates from beginning to end, so you can see the progression as industries top. A quick scroll down shows the tops rolling to the right.
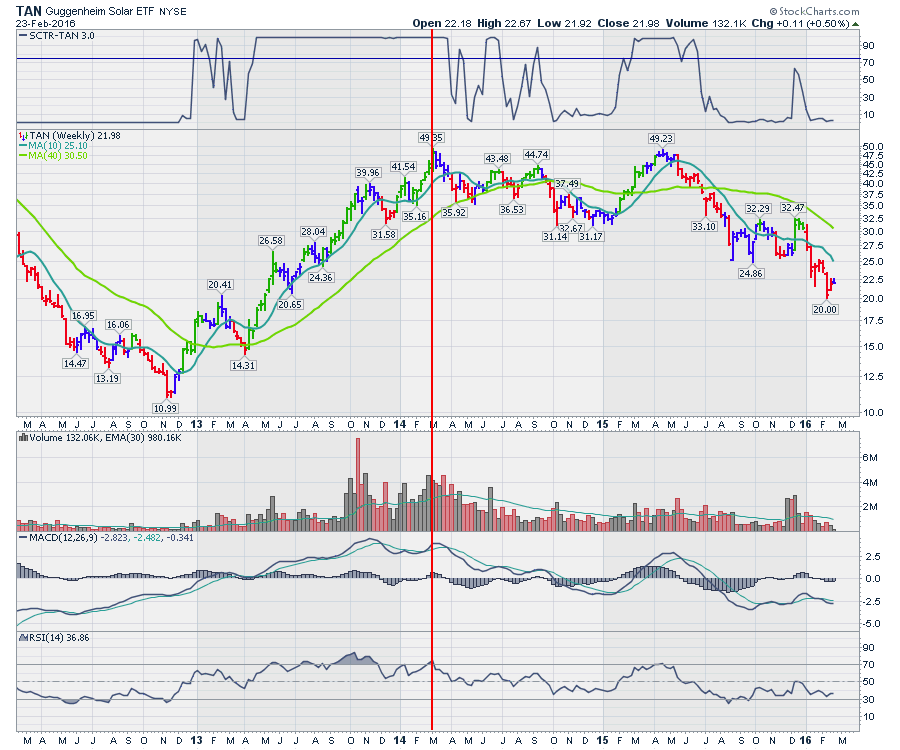
Starting with the Solar group (TAN), it actually made the final high a few months before the price of oil topped. While the solar group tested the previous highs in 2015, TAN topped before the price of oil did in February 2014. Even if the high price in April 2105 is used, there has been little upside for investors.
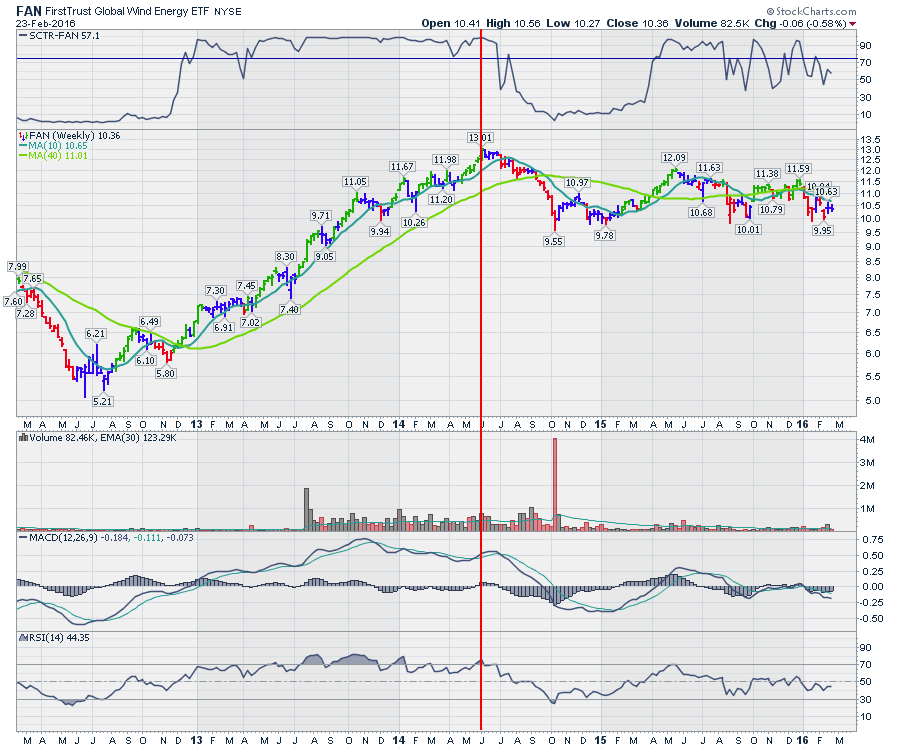
The Wind energy industry defined by the ETF (FAN) actually marked a top before the oil price did as well. We could say it didn't have the wind at its back.
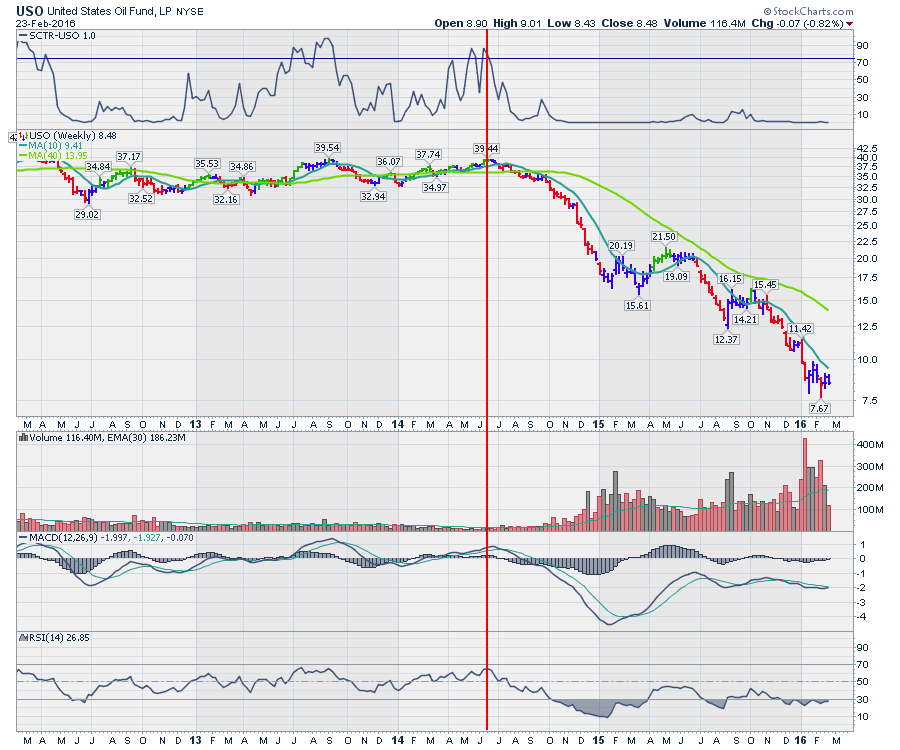
 Next, the good ol' price of oil decided its best days were behind it in June 2014. Depicted using USO ETF.
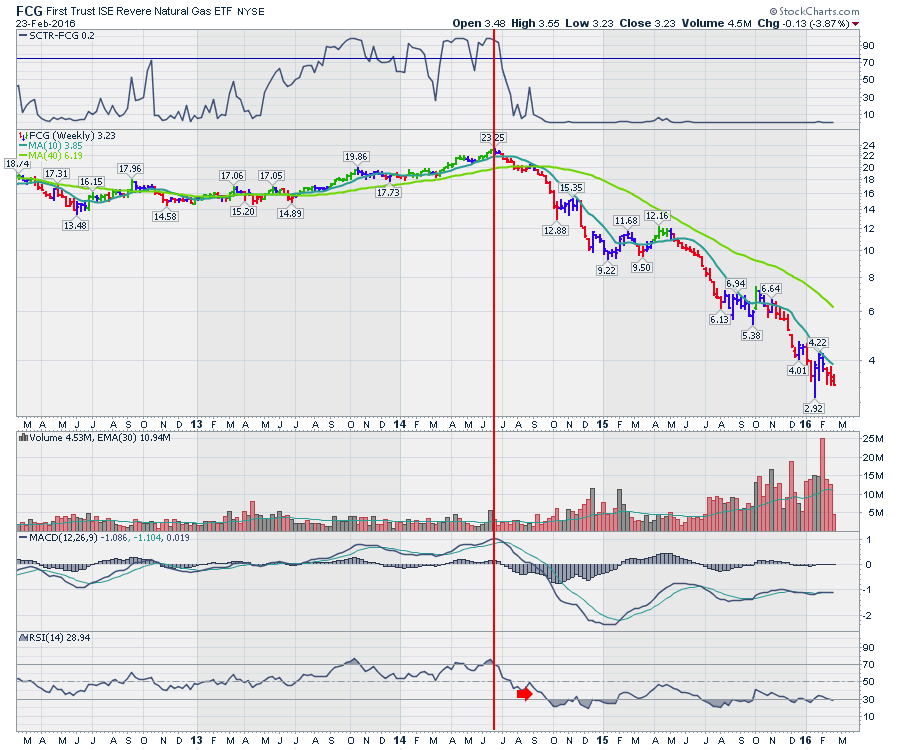
 Natural Gas didn't have any more energy left in it either. It rolled over almost right after oil.
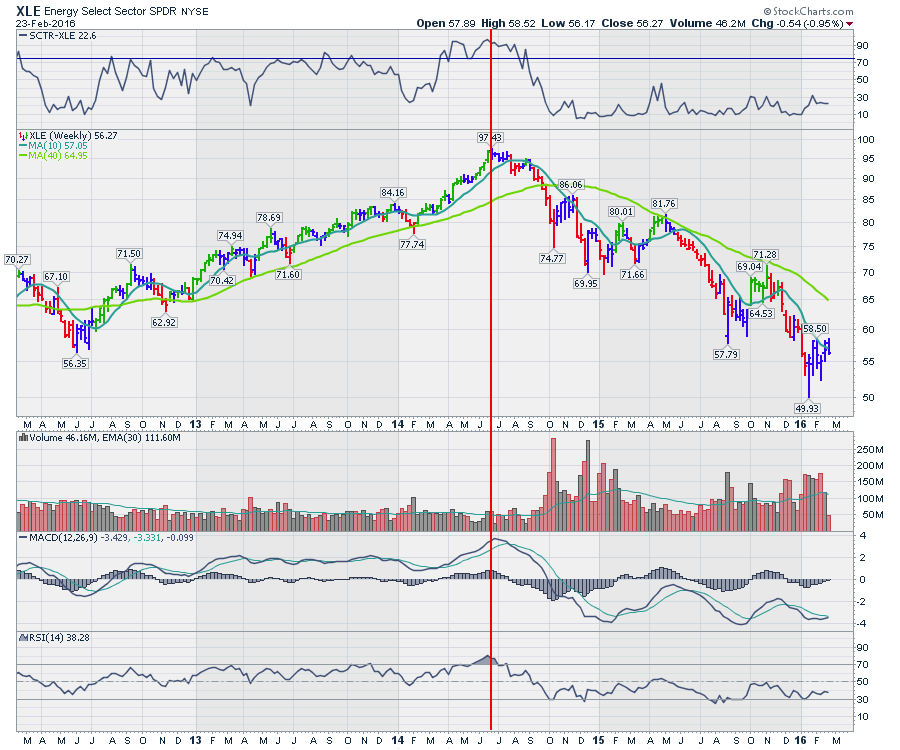
 Continuing on, the entire XLE Energy Sector topped out.
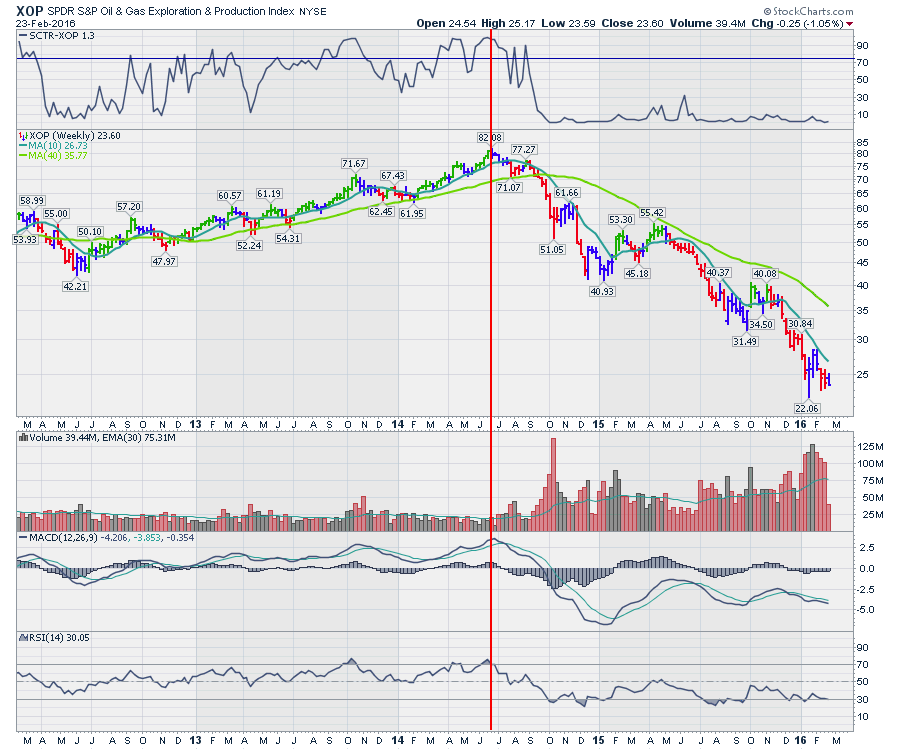
 At this point, no one knew the impact that was coming, but the train was leaving the station. To no surprise, the oil and gas producers marked the high on the same week as the price of oil did. In June 2014, XOP started down the road of lower highs and lower lows. It was downhill all the way with a brief rally to the high during April 2015.
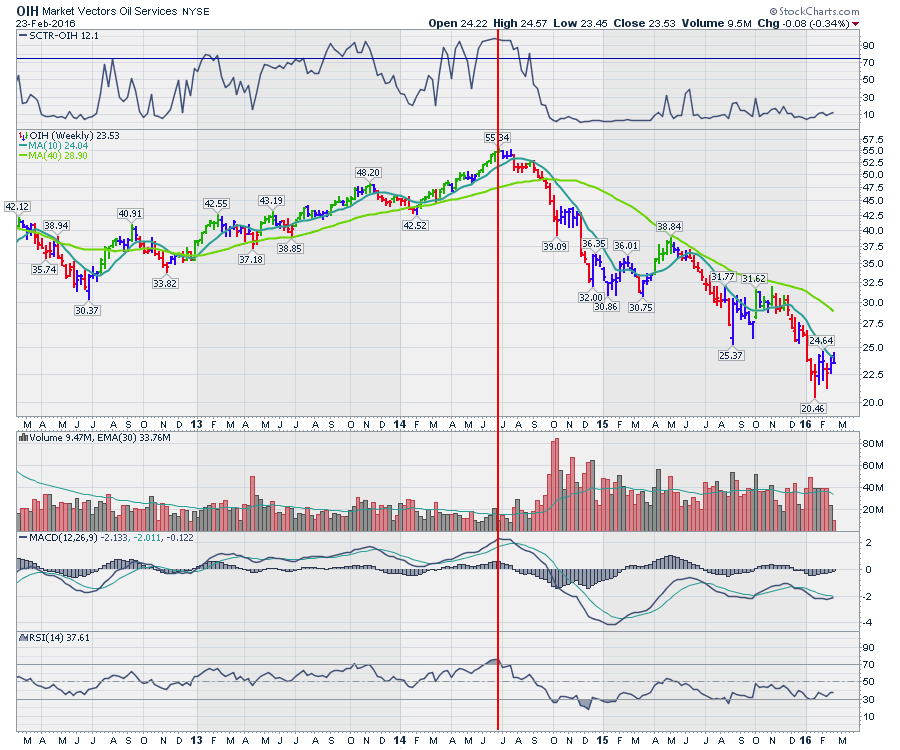
 As you can see, all the energy groups let go very close to each other. The oil services ETF (OIH) responded the next week. They drilled a hole they have not gotten out of yet.
 June 2014 was busy with lots of highs being put in, but nobody realised how things were setting up.
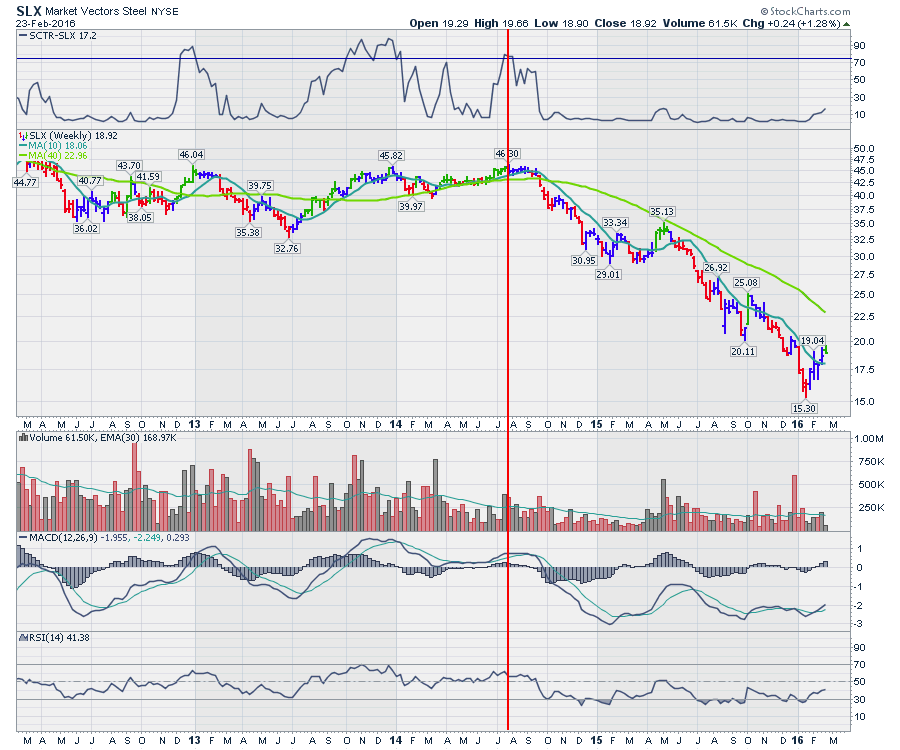
The Steel industry was breaking out to new highs in July 2014. The steel industry group (SLX) rolled over almost immediately in July 2014.
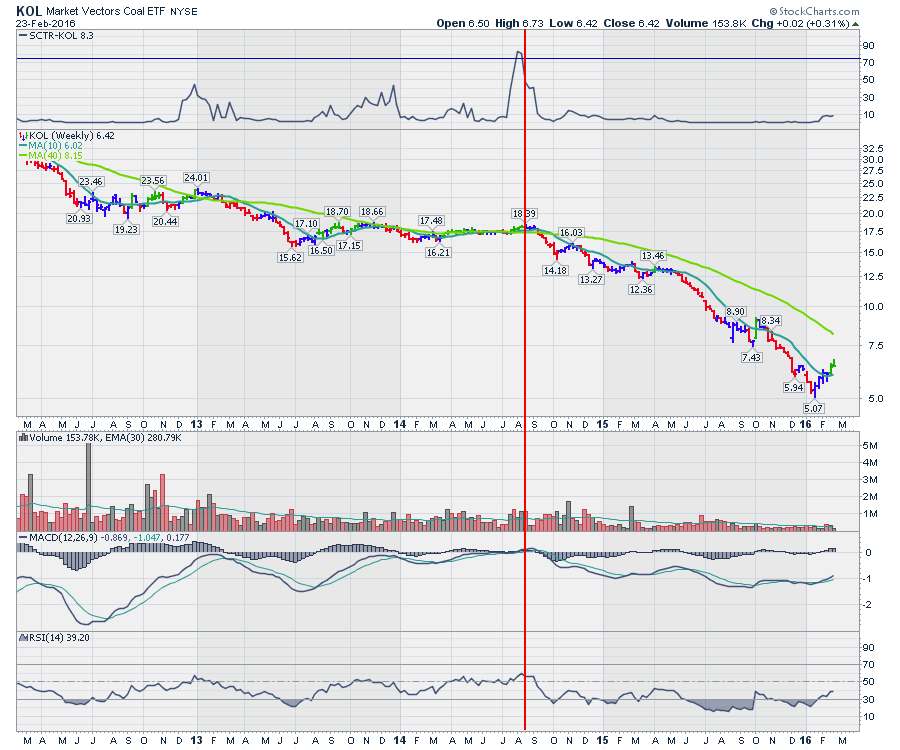
 Steel needs Metallurgical Coal for firing the smelters. Coal had been collapsing along with other raw material stocks since 2011. KOL actually topped in March 2011. KOL surged to 9-month highs in August 2014. After that, this really went down in flames. As we know, the coal industry stocks are moving into bankruptcy protection for the most part.
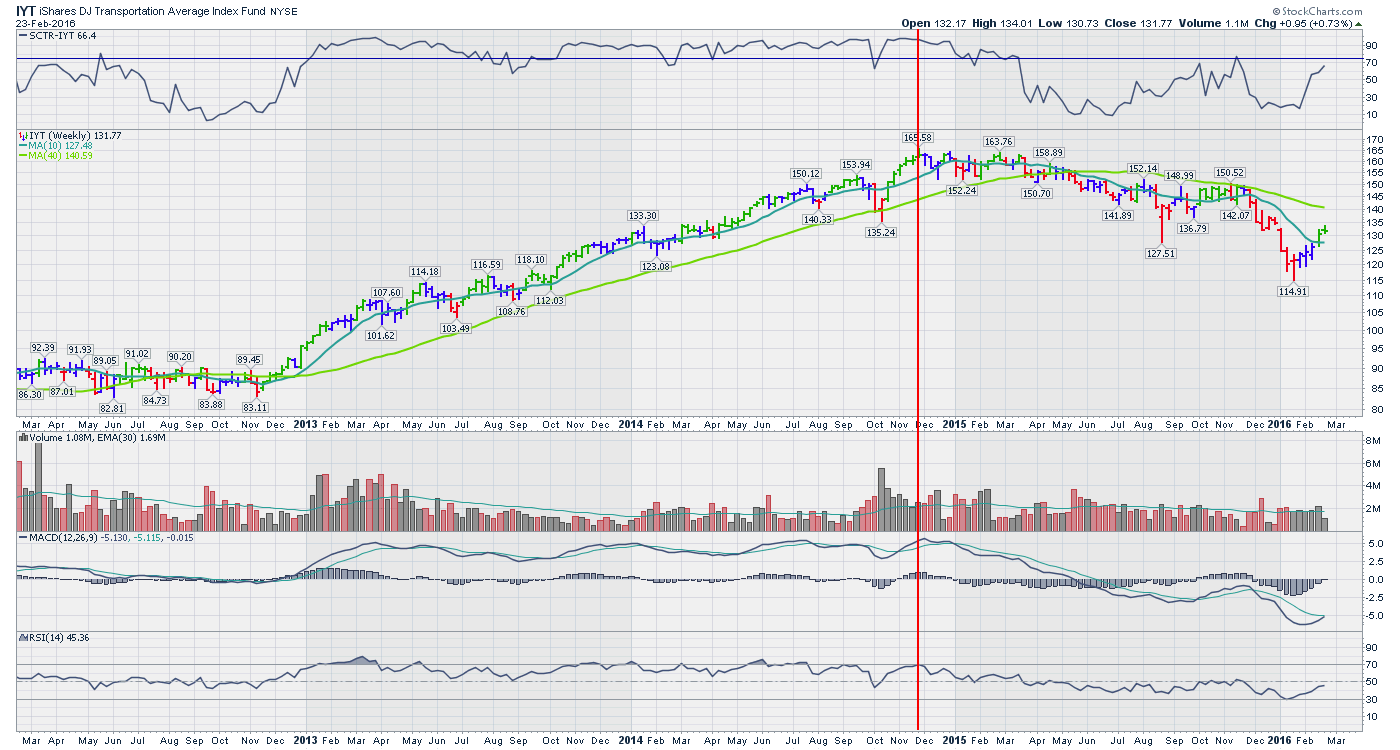
 I think the important part of the chain of events to this point is the understanding that it still is a sector-wide annihilation rather than one piece of the Energy Sector. Who would have thought that the next industry to get crushed would be the Transports (IYT)? Yes, the media would have everyone believing that the transports (rail, trucking, airlines) would be the industry to benefit from lower fuel prices. Heads up, that is not what this chart says. The transports fell off the rails within 5 months of oil topping.
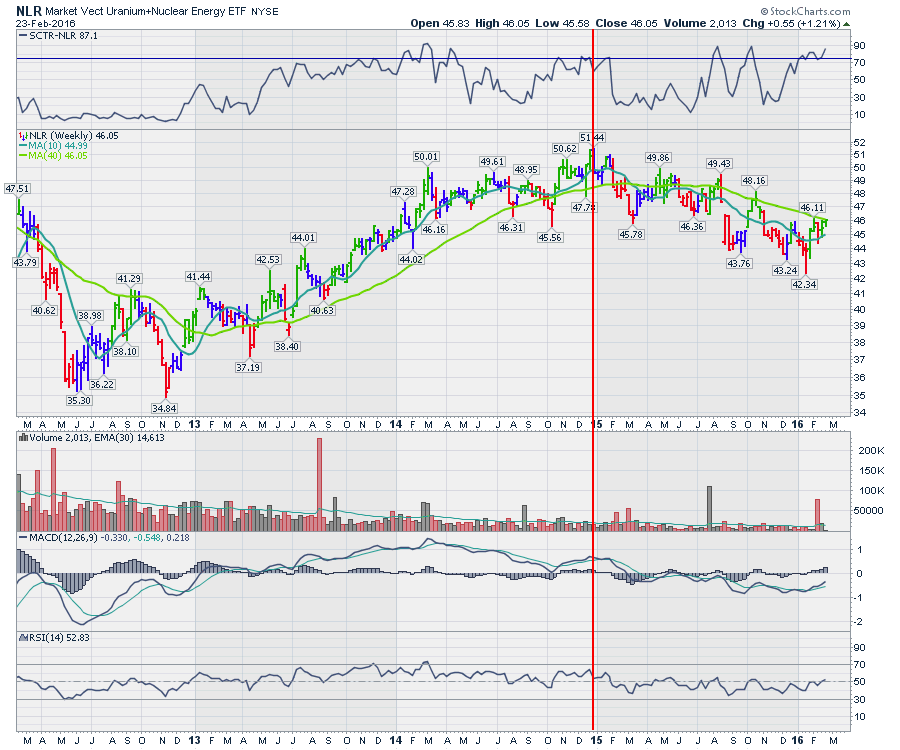
 Continuing down the dominoes, the Nuclear ETF (NLR) made its final high within 2014 as well. At the time, that industry was supposed to soar because of all the new plants in China. 15 months later, it is only 20% lower but still lower. On another note, seeing the SCTR at 87% suggests a look at this on the Commodities Countdown Webinar coming up on Thursday, February 25th at 5 PM EST. You can register here for the free webinar (no abusive emails continuing to haunt you). Commodities Countdown 20160225. If you miss it live, you can click here to go to the webinar archives and search by chronological order. StockCharts Webinar Archive.
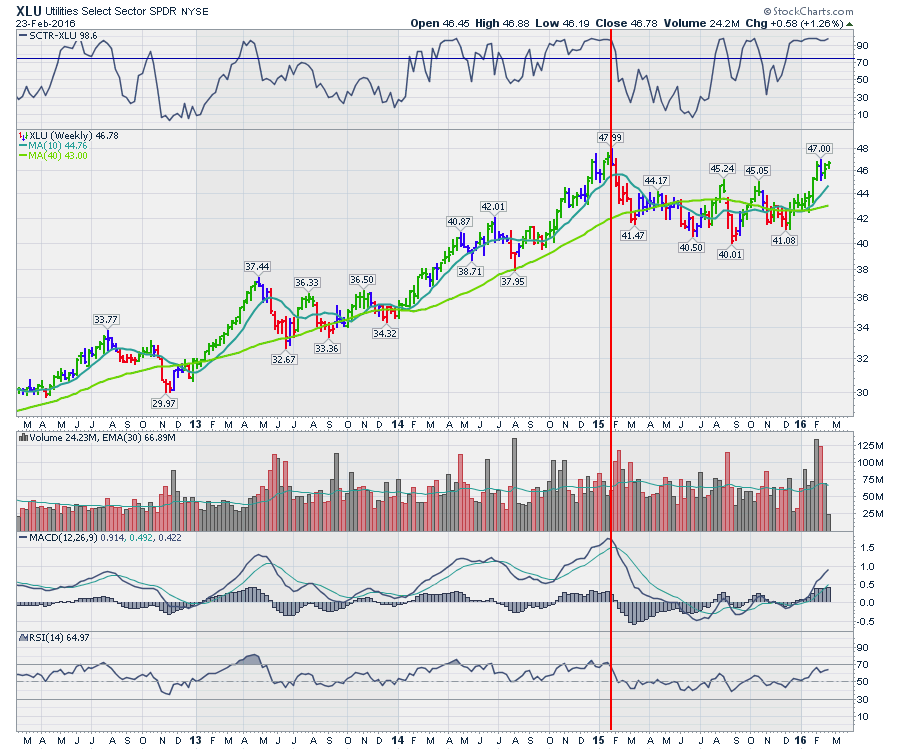
 Some of the main US Sector ETF's started to roll over as the calendar moved into 2015. Utilities can be considered energy creators as well sometimes. Lots of the utility companies are power producers creating and distributing hydroelectric power or other methods. Utilities (XLU) topped early in 2015. We can see this ETF is starting to test the previous highs right now in February 2016. The SCTR is presently up at 98.6 as defensive sectors lead the market right now.
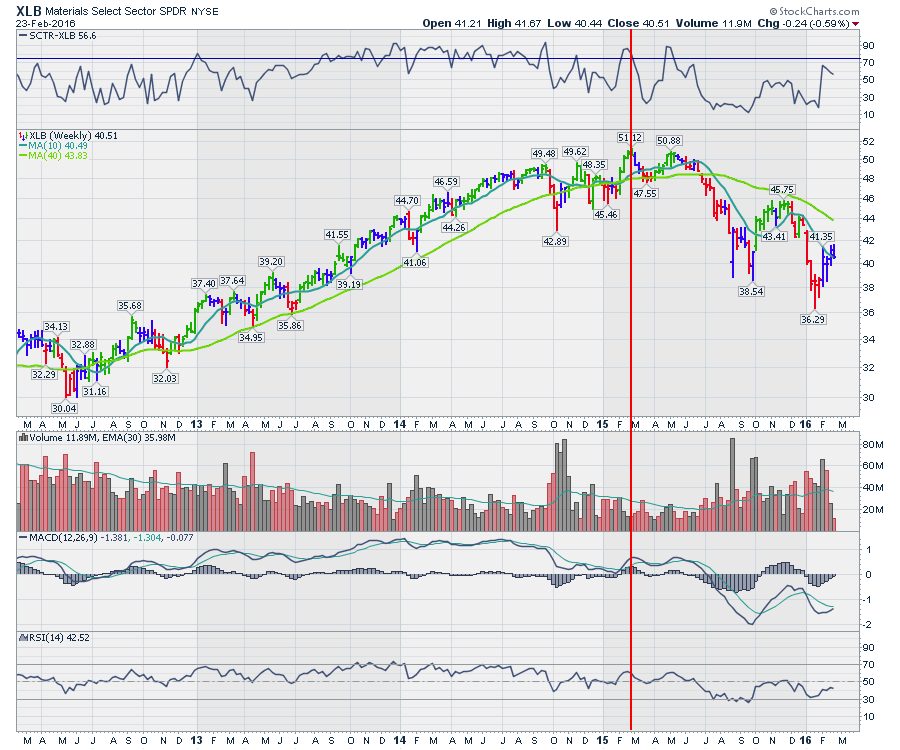
 XLB is an odd beast from a 'Materials' Sector view. Because it is dominated in the US by Dow (DOW) and Dupont (DD), it has a heavy weighting towards industrial chemicals rather than raw 'materials'. The oilpatch uses a lot of chemicals, as their pipelines need coatings for example, and downhole solutions use a lot of chemical technology for oilfield applications in different reservoirs. XLB rolled over in February 2015.
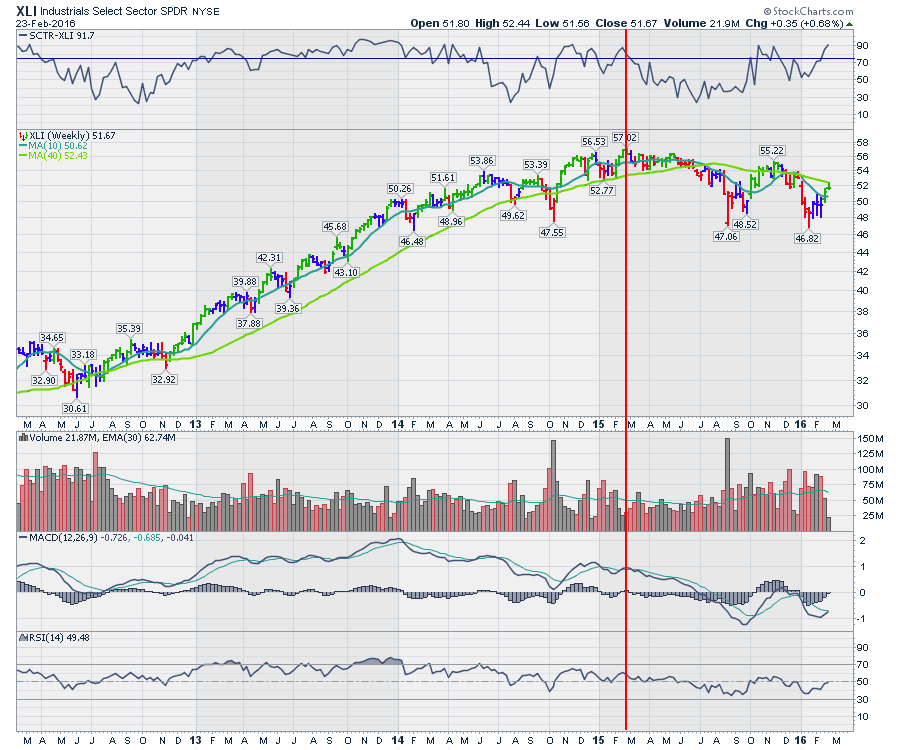
 Sure enough, the oilpatch orders going into the Industrial Sector started to slow down. The transports are part of the Industrial Sector. As the steel industry slowed, the rails hauling coal, iron ore, and oil slowed. Even CEO's who remained in denial finally admitted in 2016 that freight volumes were declining long after their company stock was moving south. Investors knew, even if the CEO didn't.
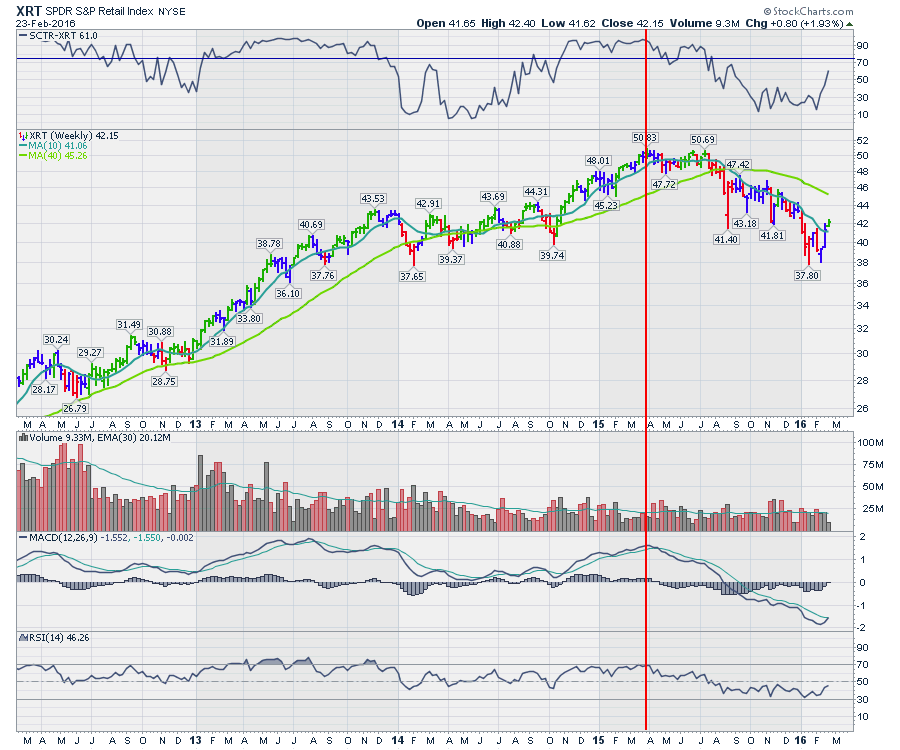
Interestingly enough, the retail industry group was doing well coming off a strong 2014 Christmas. Retail usually rallies into March and pulls back towards July. In 2015, the retailers were fading for the rest of the year. Macy's rolled over a little later into July 2015 and never saw a rising tide again. Underneath, a combination of slower sales in the weaker retailers would drag down the industry. Home Depot and Amazon were doing well, but Walmart was falling. The market didn't wait for the quarterly results. Everyone was shocked by the weak Christmas 2015 but the transports (shippers like Maersk - November 10, 2015) were complaining about weak volumes by then.
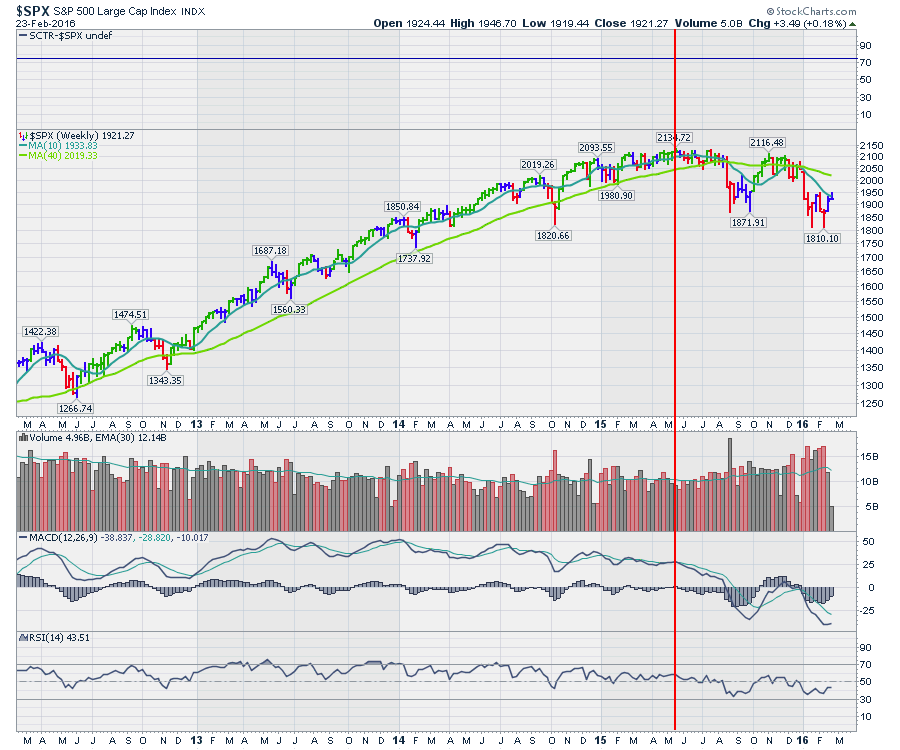
In May, the $SPX made its final high for the year. With a wide group of sectors unable to keep pushing higher as energy slowed the trend, the $SPX topped in May 2015.
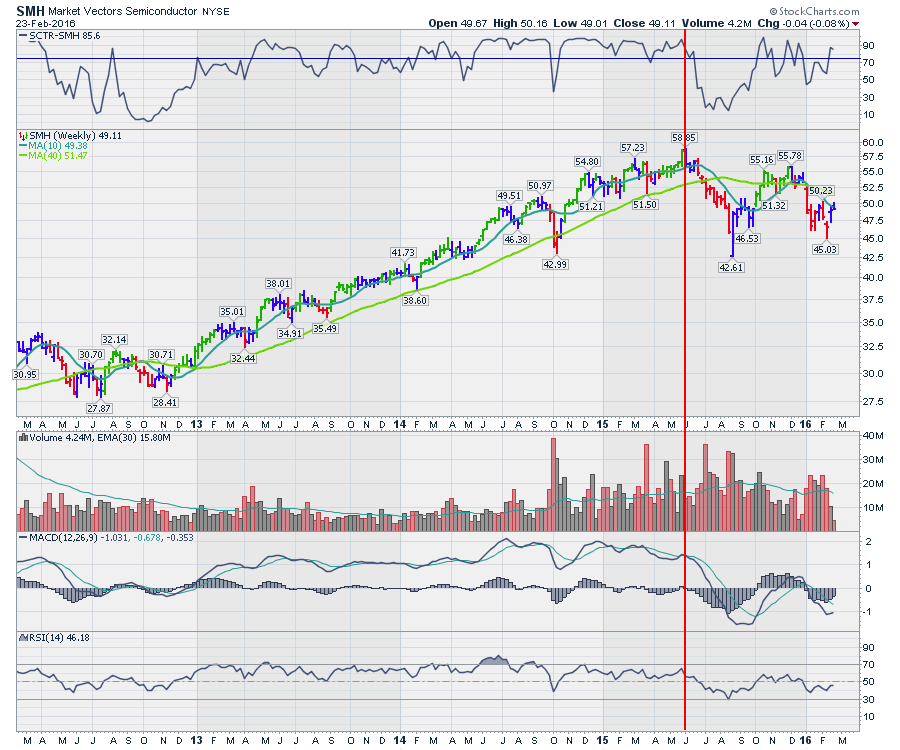
 The semiconductors (SMH) would start to slow as well. This was probably just a recognition that risk was coming out of the markets as the $SPX made its final high. The Semiconductors sold off aggressively dropping 25% in a few months. The Semiconductors are considering an early warning industry. When Semi's are slow, the market might have bigger problems. In this case, the semi's were making their final highs a week after the $SPX topped.
 At this point, XLE, XLU, XLB, XLI have made their highs. Remarkably, the $SPX topped even before the financials. The Financial Sector makes up a significant portion of the $SPX.
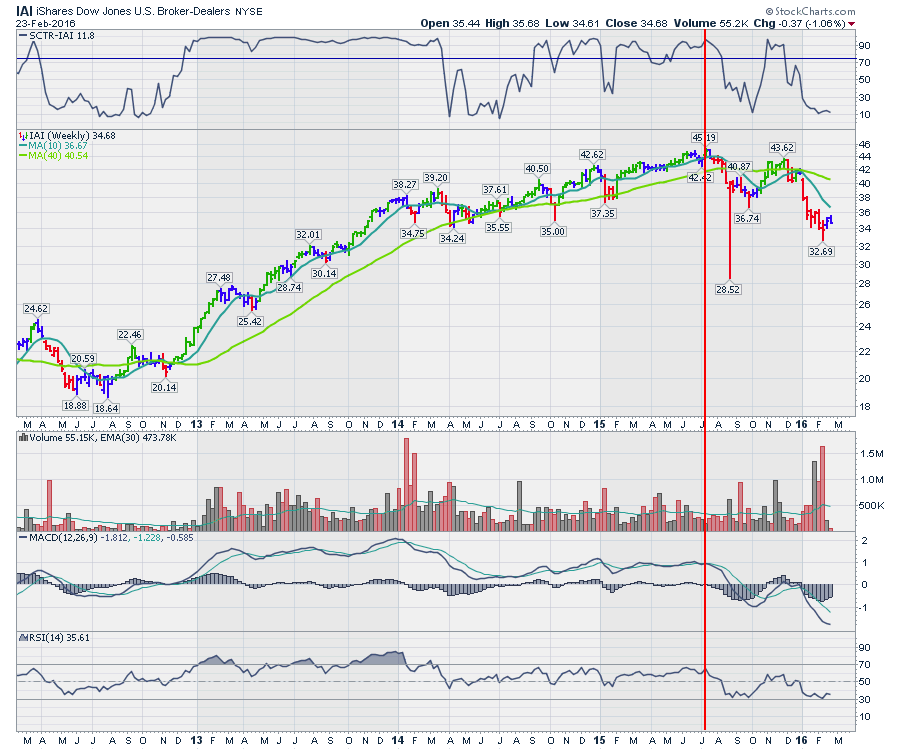
The Broker/Dealers (IAI) are also considered a leading group. Interestingly enough, they broke down as one of the first industry groups in the Financials Sector.
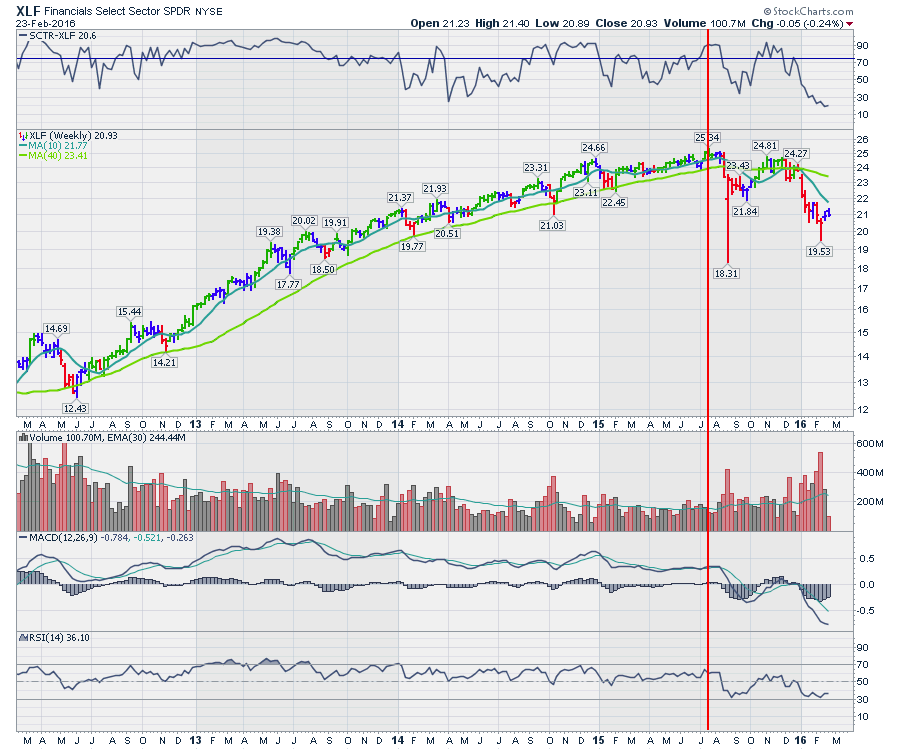
 Next, the Financials Sector rolled over. Obviously, some of the other industry groups within the financials were starting to break down before the banks, but clearly, investors were losing faith in the XLF leadership position even as the Fed said higher rates would be coming.
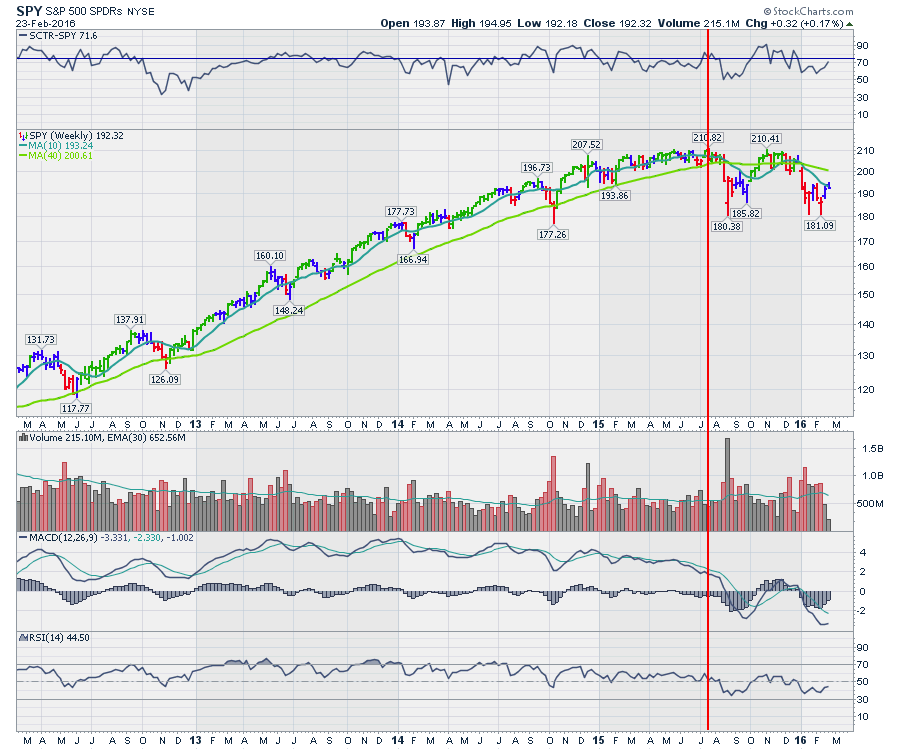
 Because of dividends, the $SPX tracking ETF, (SPY) actually made its top in July rather than in May when the $SPX actually topped, as the brokers started to retreat.
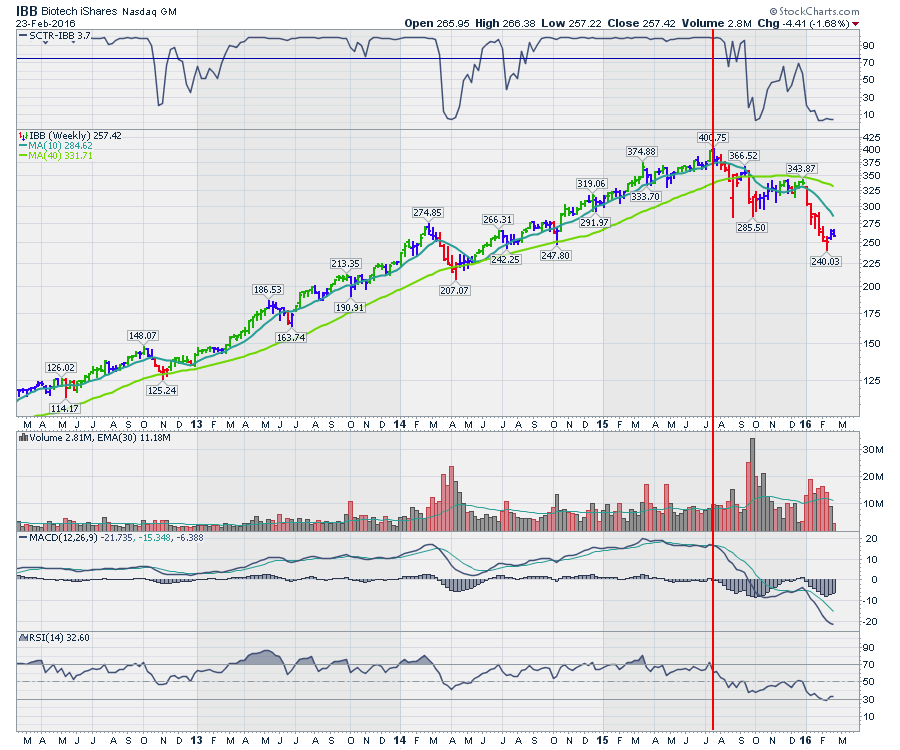
 At this point, only the Technology, Healthcare and Consumer Staples Sectors were still standing. The Biotechs and the FANG stocks had been holding the $SPX up while the number of stocks above long-term averages(200 DMA) had fallen away.
Now the leaders were about to see their owners sell into any rally. This was the final top in July 2015. From the days after the Options Expiration day in July, the market sold off heavily. The leaders were losing their influence. Notice that the biotechs put in a new low in February 2016. This leadership group has fallen 40% without any 'correlation' to the energy industry.
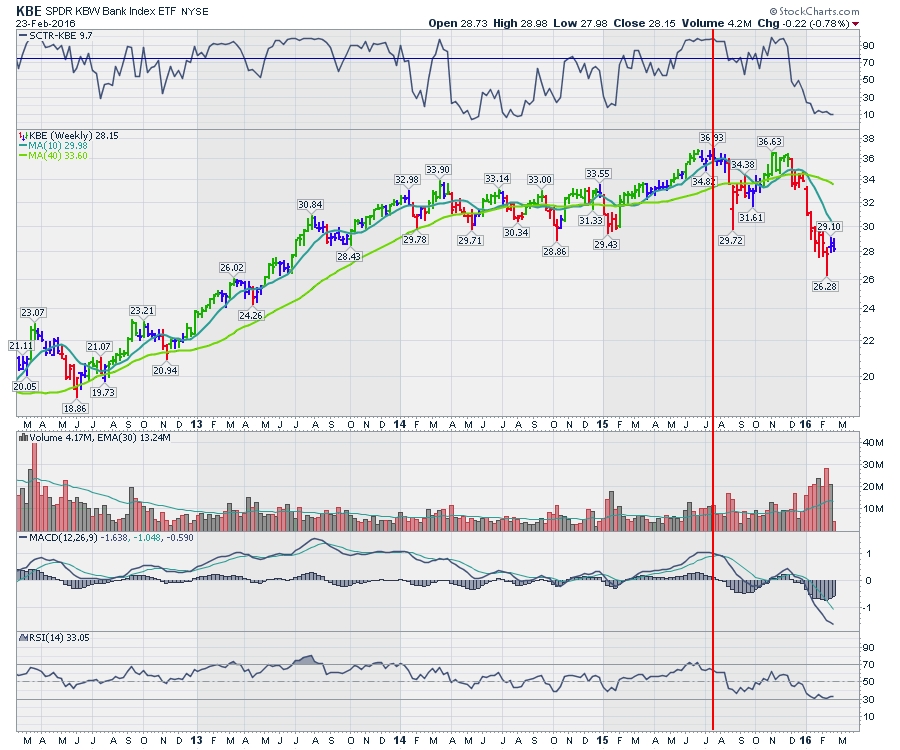
 Next, the cat and mouse game around the rise in interest rates would take its toll on the banks. The KBE marked a top in July as well.
 The Fed continued to say it was data dependent. The pressure on the interest rate rise by the Fed moved to September when nothing happened at the end of July.
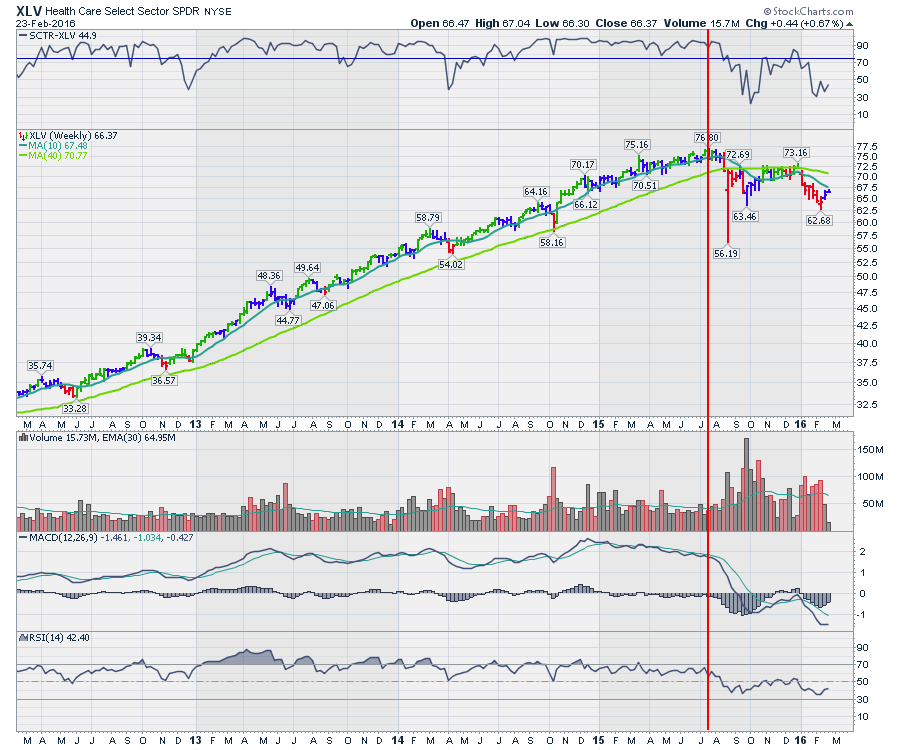
The Healthcare Sector was always considered a defensive sector in the past. Hospitals, extended care facilities, drugs and other medical industries were stable for the last 40 years as people continued to get sick and this was not a cyclical group. With the stunning technology gains coming from the Biotechs, the Healthcare Sector has become a growth sector. It is probably no surprise that it was one of the last growth sectors to roll over as the defensive 'health care' component started to rise while the high-momentum Biotech industry group fell, all within the sector. But when Biotechs topped in July 2015, so did the Healthcare Sector.
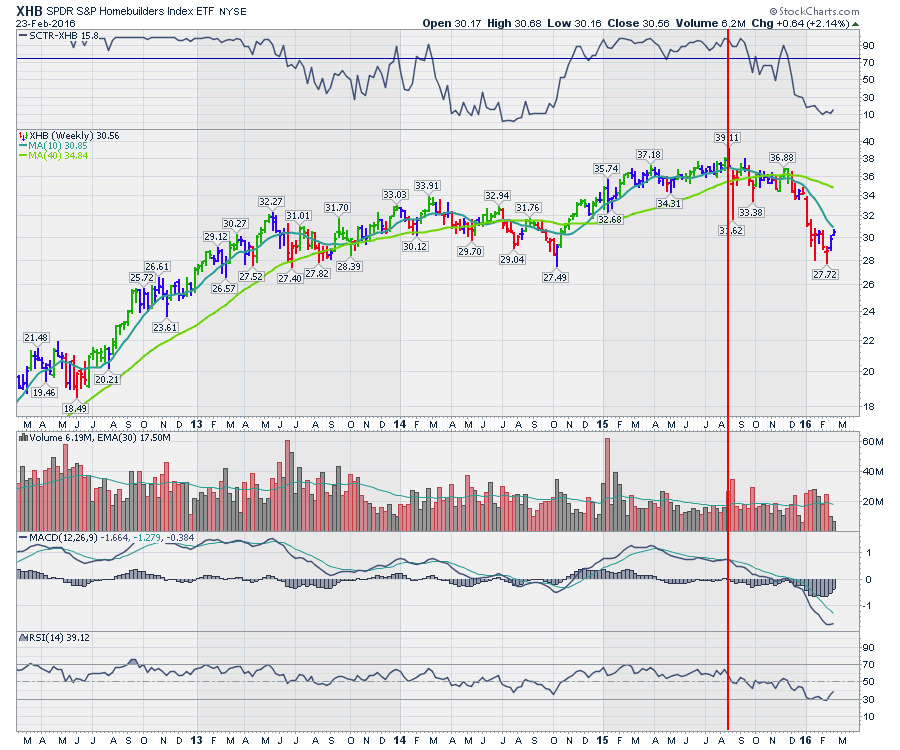
 Homebuilders were having a great year. Everything was still going right for them. The XHB made it's final high a week before the summer selloff and the August 24th Monday morning plunge of a 1000 Dow points.
 Continuing through the sectors, only Technology, Consumer Discretionary, and Consumer Staples were still making higher highs after the Summer swoon.
After the stock market tested the August lows on September 29th, a rally ensued. It was a ripping rally that froze anybody short. It moved so fast it gave them little chance for a profitable exit. But as the bear market was taking hold, the swings were getting wilder and more aggressive every day. This increase in volatility shows up in bear markets.
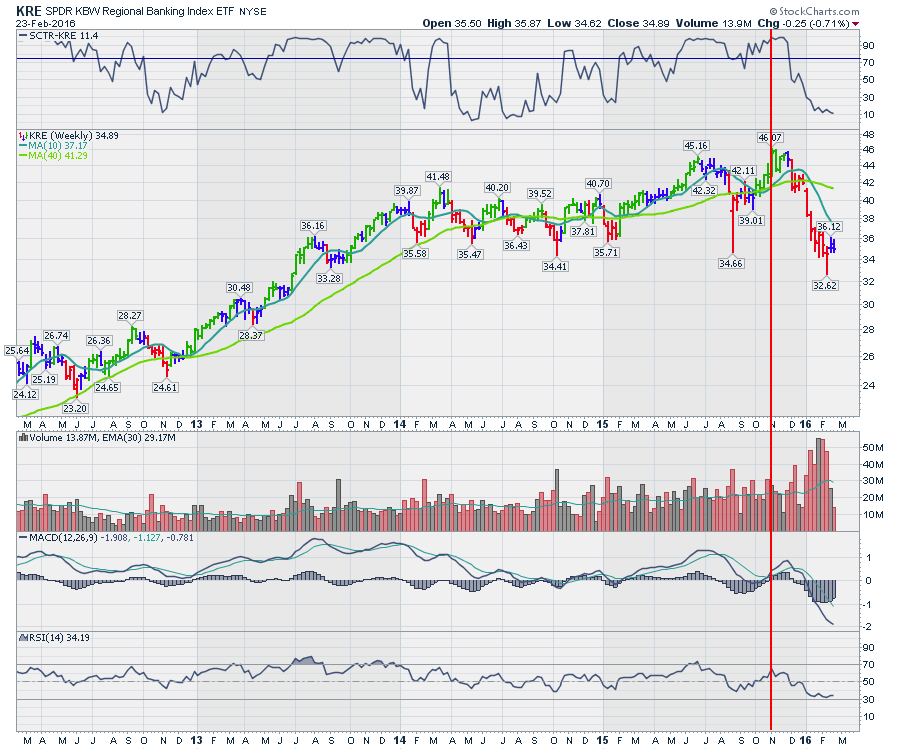
The Regional Banks had held up better than the Systemically Important Banks. The media focus was that it was only a few small banks who would be impaired by the oil industry pullback as it continued into its second year.
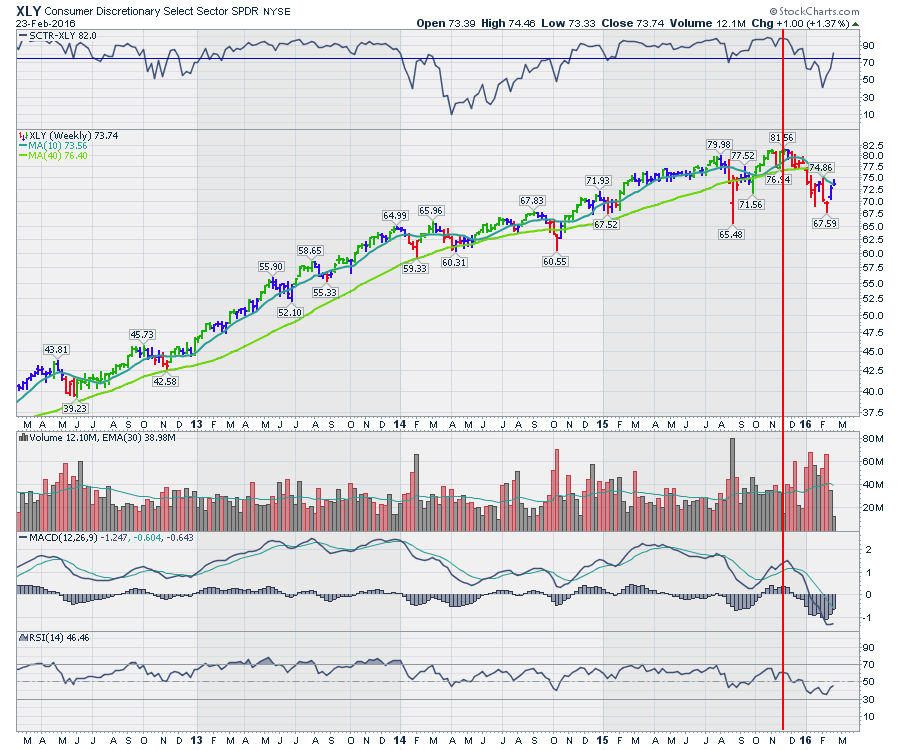
 Interestingly, the Consumer Discretionary Sector (sometimes called the Consumer Cyclicals Sector) topped out at the end of that screaming October rally. Leaders like Disney, Nike, Amazon suddenly lost their momentum-based investors in the fourth quarter. Disney topped as the new Star Wars movie release date approached. Even the biggest grossing movie of all time could not propel the stock higher.
 The final gauntlet had been thrown down. The FANG stocks were all the rage. Facebook, Amazon, Netflix and Google. Could they continue to hold up in the face of declining breadth? Almost every other sector was below the 200 DMA but the Internet Index and the Technology Sector had yet to top out.
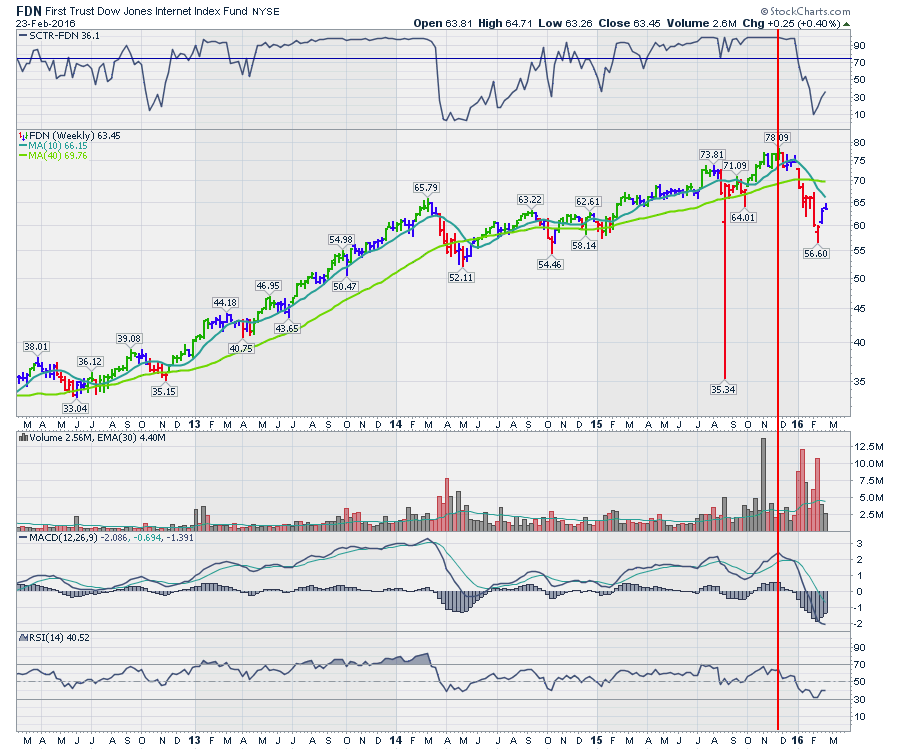
The Internet Index made its final high in late November 2015. When it let go, it lost more than 20% into early February. The correlation to the oil business is obviously low, but the fact that the other sectors were slowly succumbing to the pressure of the continued decline in oil was becoming real.
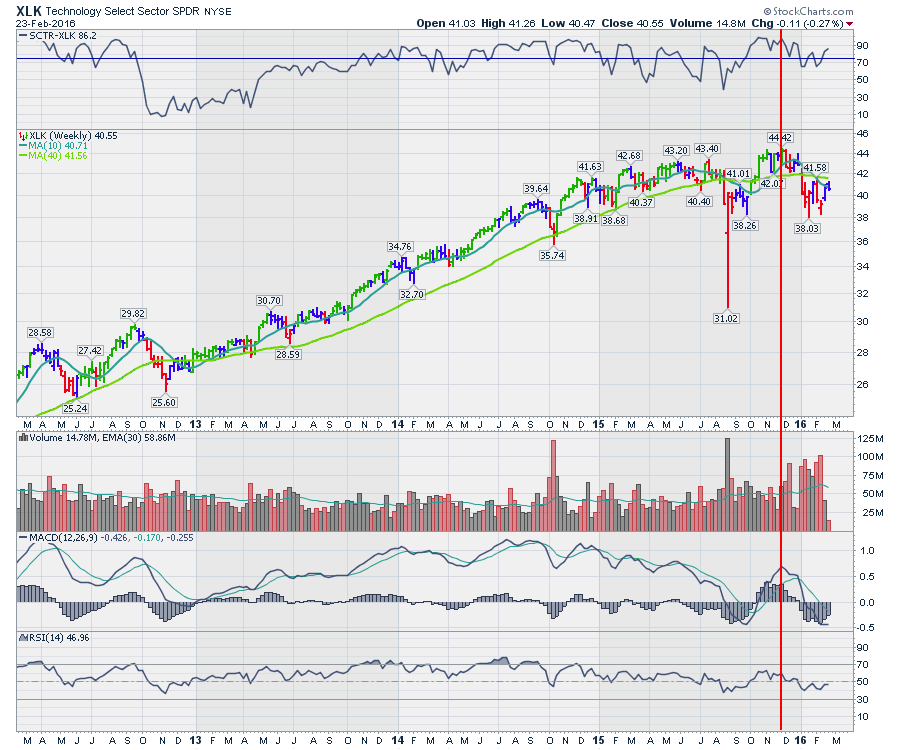
 The Technology Sector, the XLK, holds the massive companies like Google, Apple, and Microsoft to name a few. The XLK would succumb to the slowing global growth on the back of the global drop in demand that had struck every other sector. Now it was starting to influence the Information Management and Technology investments according to some of the CEO's.
 The ETF representing Cybersecurity, which doesn't have a long enough timeline to be shown here, continues to move lower, even though the cyber threat is increasing every year.
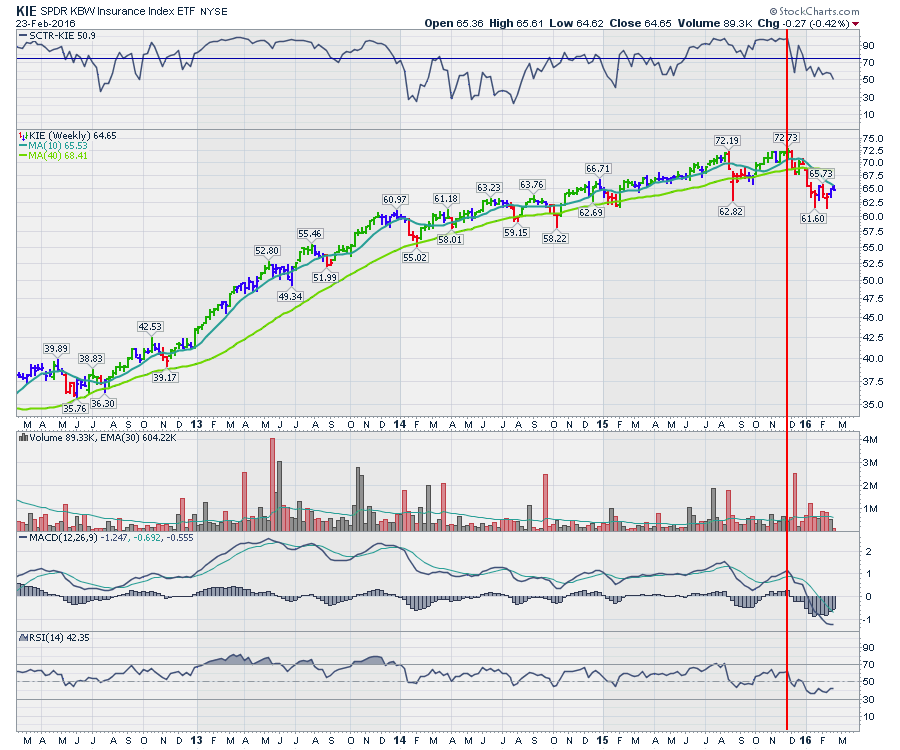
Insurance, which is part of the Financial Sector, rolled lover late in November 2015.
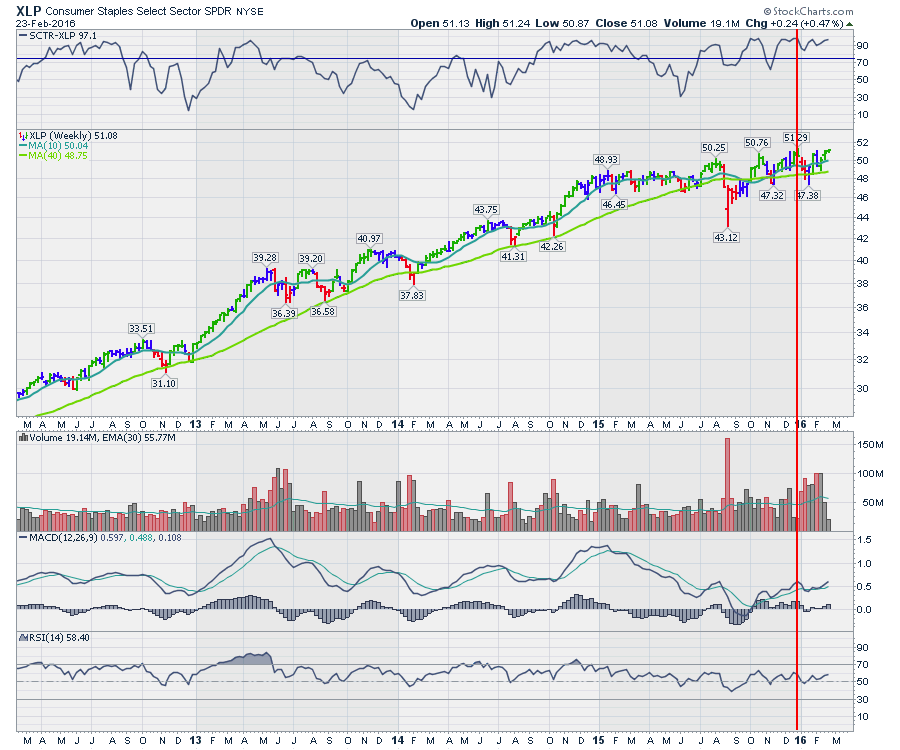
 Not everything is going down. Some things rise when the going gets tough. The Consumer Staples (XLP) Sector is one of those sectors that investors turn to when cash flow is an important metric and the actual growth of the business is not. If fund managers can hold their capital and get some dividend payments, the investors are happy to wait while the storm ripples through the rest of the economy.
I posted the Utilities (XLU) chart earlier on, but now that the threats of interest rate increases are largely put off for the foreseeable future, this sector has come into favour for the same reason as Consumer Staples. Stable cash flows in a low growth or recessionary economic backdrop.
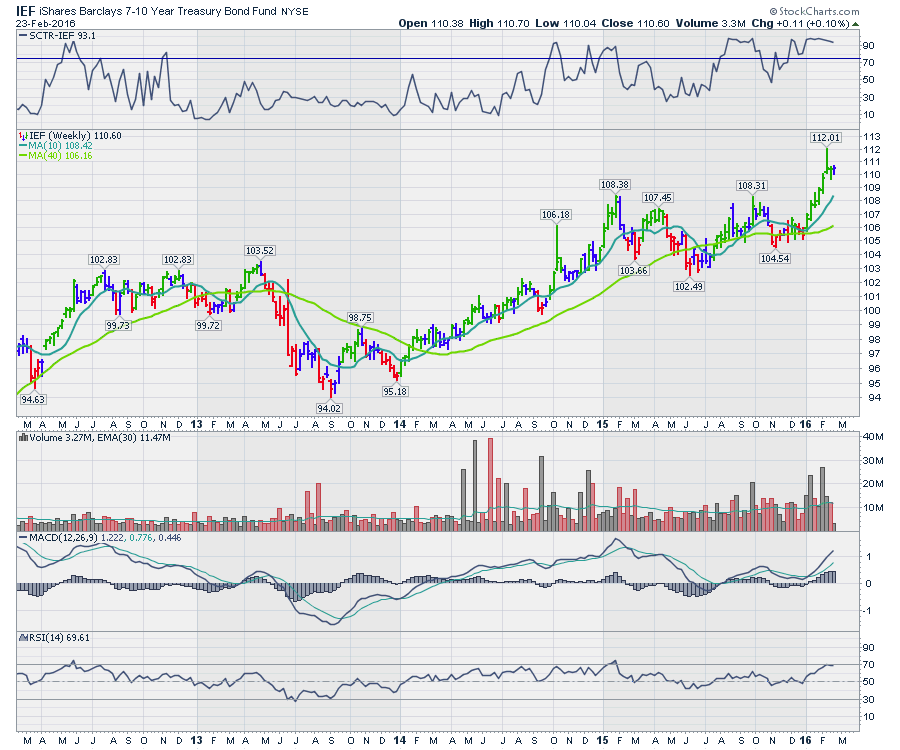
As well, investors move towards Bonds. The use of ETF's have made it easier for investors to participate in bond funds, but that does not mean there will be liquidity when the world wants to rush back to equities and sell these bond related ETF's. Here is the 7-10 year treasury ETF (IEF).
 Gold has recently surged to new highs, but I think it confuses the story, so I'll leave it out for this edition.
The purpose of this article is to describe how each sector has been affected, creating the global slowdown of the entire world. There are a significant number of countries that rely on the trade created by the energy industry worldwide. Even countries that might not create energy have supplied industrial goods to the rest of the world and the lack of orders is creating a demand slowdown. The fact that we don't have any signs of higher lows, as we near the 20-month mark, is the next battlefield. The Energy Sector decimation, as well as the industrial slowdown, has gone on so long. It is the length as well as the size, that is creating this problem. Unlike 2009, where it was a 9-month dip for the Energy Sector, the duration of this event is the problem. The number of companies with loan ratios that are blowing up continues to accelerate as the companies have not had any free cash flow for over a year in many cases.
While many have the belief that it is no big deal and the consumers will reap additional billions a year in gasoline savings, the charts speak differently in my view. The fact that the transportation companies talk about dropping levels of container freight is not bullish. Apple noticed demand weakness in China. How big does a demand slowdown have to be on a scale of a $700 Billion company? While the optimist would suggest it has nothing to do with global slowing as it is not in the energy space, global demand broadly is being impaired. China is feeling the effects of their internal conditions, but the global slowdown is weighing on the country in a big way.
Jamie Dimon of JP Morgan mentioned on February 23, 2016, that the ripple effect from energy was larger than first thought and the stock sold off 4%. While JP Morgan will survive, many suppliers will not.
Mexico has 30% of their government revenue from oil. Mexico is just one example of how global government debt is being piled on after weathering the financial crisis of 2008.
In conclusion, the longer we wait to see the final lows in oil, the deeper the potential for more debt contagion and a more significant global recession becomes. We'll need to see some major action to fight off the effects of this storm globally.
Natural Gas is 50% below marginal production and oil is about 50% below marginal production. That puts increased pressure on the renewable energy industries as well as nuclear, coal, and hydroelectric. As long as the Energy Sector is still plummeting, the end of this problem is not in sight. Keep in mind that the Materials Sector is also being devastated currently, and many of those companies have lost 80% of their value. That is a 5-year problem in March 2016 that everyone conveniently dismisses. The debt issues there are also blooming.
Hopefully, the charts have allowed a small viewpoint at how each industry was affected and why this problem does not appear to be ending. We have not even started on the debt implosion created by this slide. The last time (1982) this happened globally, we did not have the derivatives systems and credit default swap insurance systems we have today. The question in my mind is about how the less resilient economies handle the crisis and what the spillover is with all of these third party linkages.
For more information, there will be more coverage on the Commodities Countdown Webinar coming up on Thursday, February 25th at 5 PM EST. You can register here for the free webinar (no abusive emails continuing to haunt you). Commodities Countdown 20160225. If you miss it live, you can click here to go to the webinar archives and search by chronological order. StockCharts Webinar Archive.
Feel free to forward this article to friends. It is my opinion that we are still early in the bear market cycle and the long-term charts suggest that. You can follow me @schnellinvestor on twitter and you can also click Yes below on these free articles to subscribe. You'll only get a few articles each week so this won't be 'inbox abusive' but the article will be commodity related. Please feel free to link to my LinkedIn ID as well. https://ca.linkedin.com/in/greg-schnell-40730544
Good trading,
Greg Schnell, CMT, MFTA.
