Oil has been breaking out. What to do if you missed the giant rally so far? Should you get on board? Let's work through the charts to see if this is worth participating in. The first chart is US based Oil - $WTIC.
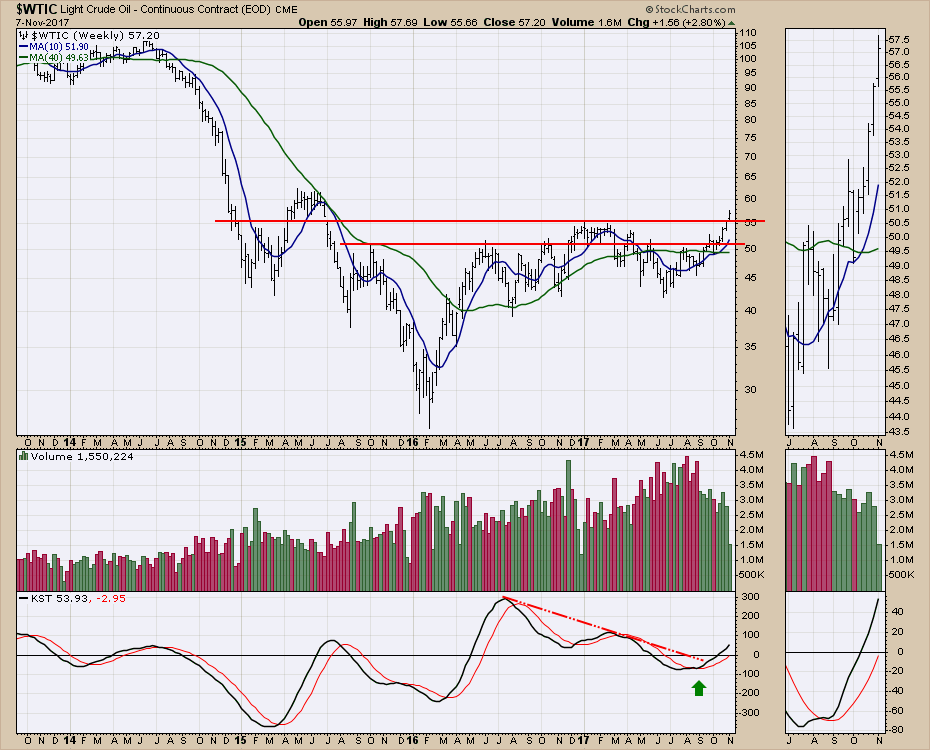
The downward trend on the KST is turning up and the KST is just moving above the zero line now. The breakout on price to new two-year highs is very bullish with this KST setup. Also the KST found support near the zero line rather than a deep oscillation so this is also a very positive structure.
Looking at Brent crude ($BRENT) this is also bullish and has been pointing higher for three weeks after breaking out. Currently the Brent price is $6 higher than the US $WTIC price so crude is destined for other parts of the world and away from North America to capture the higher prices.
 Three charts from the eia.gov website show what is happening to oil and finished product supply levels or inventory levels. The first is total US crude stocks. The line represents the last 21 months and the shaded area represents the range of the last five years. We are at the lowest inventory levels since 2015. While we are still near the top of the range, the pace of decline is rapid and has been since March.
 Source: US Energy Information Administration
The chart below shows total gasoline inventories. They have moved to the middle of the five-year history recently. As it approaches the bottom side of inventory, price is more likely to continue accelerating. Notice how tight the range has been over the last five years and we are declining into it. The current level is also as low as 2015. It will be important to watch and see if gasoline inventory trends rise in the next six weeks as they do historically. Notice the range for the next few months is shown in front of the blue line.
 Source: US Energy Information Administration
Lastly is distillate. Distillate is diesel fuel, home heating oil, and is similar to Jet-B fuel. Notice how the volume in storage is in the bottom 25% of the five-year range. That is problematic.
 Source: US Energy Information Administration
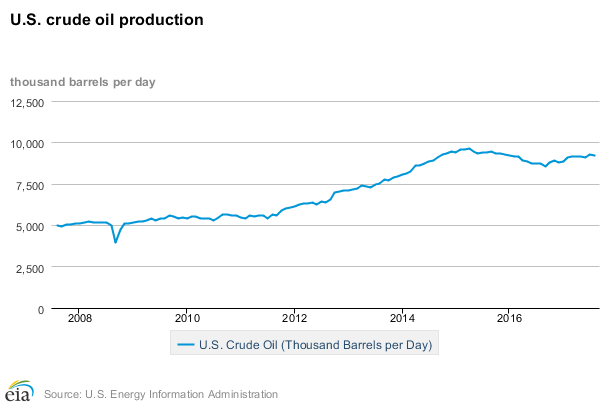
With inventory levels declining in all three, this can be supportive for prices. That is current supply. How about changes in production levels? Below is another chart from the EIA.gov showing current crude oil production. Production has levelled off. The end of July and the end of August both were around 9.2 million bbls/day up 5% from a year earlier. This is before the effects of the hurricanes. Watching this growth rate into the later part of 2017 will be critical, but the huge declines in inventory with some production growth shows that something has to speed up awfully quickly or demand has to moderate quickly. This may happen as part of a seasonal trend.
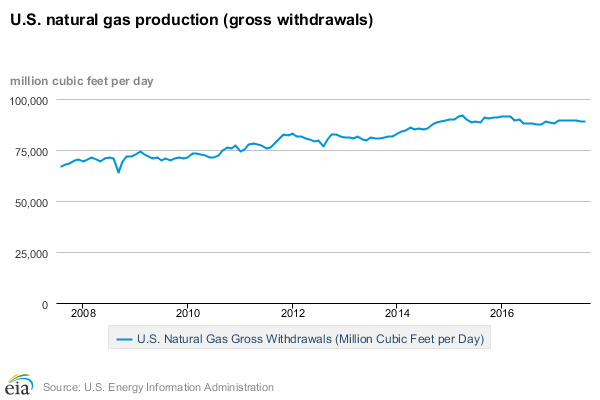
 Natural Gas production is also flatlining.
 What does all this mean? They energy supply/demand imbalance is rapidly tightening. With foreign markets paying more for crude, the crude oil tankers and finished products tankers are shipping into other markets. This tightens supply here as well and firms up prices.
Lastly, the number of new mega-projects coming on stream over the next few years has been dramatically reduced because of the slowdown in 2014, 2015 and 2016. This huge lull in major supply could be a big factor if these supply situations continue to tighten. National production still is lower than 2014 or 2015. 9.6 Million barrels were produced in April 2015 and the trend is still rising in 2017 but the highest month is 9.2 Million barrels. Colorado has some of the highest growth which is up 25%. The Gulf of Mexico production is flat on the year with 1.76 Million barrels in January and the same in July and August.
When a new well is drilled, it immediately pumps a lot of oil, but rapidly declines. In order to maintain growth, companies have to drill wells faster, complete them faster and use more rigs to maintain growth rates rather than just replacing declining volumes. This treadmill becomes more and more difficult. 2015 wells were drilled but they did not sell the oil to market until the price improved. Later in 2016, that volume came to market. The expectation that there is new volume to flow in the latter months of this year is weak at best.
Without getting into the situations in Venezuela, scud missiles aimed at Saudi Arabia, princes in jail, Iran heating up, North Korea in the hot seat, the largest number of aircraft carriers deployed and many other issues, this looks more like a supportive price environment for higher not lower.
What is the trade?
I have a chart that I like to use that demonstrates the Bullish Percent Index for Energy($BPENER). With the data turned on lightly in the top panel so you can see the lines, it is messy. However, the MACD tells an interesting story and it is one we have followed all year on the Commodities Countdown. We expected a major three year low in oil and we got it in June 2017. The MACD gave a positive cross on June 29th and it has been running ever since. We can't trade the $BPENER, but we can trade the energy stocks through the XLE (top panel) or the XOP (lower panel) or individually.
 When these runs start, they can be long and prosperous, lasting many years.
The inventory setup, complete with production room to grow, higher markets overseas, instability in geopolitics, and a chart breaking out from the lows, suggests it's time to ride this pump jack; hopefully for a three year run. But one day at a time, this looks like a sunrise for the oil and gas stocks. It might need a breather as the RSI is a little high, but good runs make it difficult to get in on. Try to find an entry and hold on.
Good trading,
Greg Schnell, CMT, MFTA
