 Editor's Note: We are very pleased to announce the return of Greg Morris - the author of "Candlestick Charting Explained", "Investing with the Trend", and "The Complete Guide to Market Breadth Indicators" - to StockCharts.com. Over the course of the coming months Greg will be updating his Market Breadth book via articles in this new blog. (The articles for the new version of his book will have "CGBMI" at the end of their titles.) Enjoy!
I am delighted that StockCharts.com has spent the time and money to greatly enhance their breadth data. I have used Pinnacle Data for a long time and believe it is one of the most reliable sources for breadth data in existence. This improvement not only added new data, but extended the data history by decades. This first article will introduce breadth and its components along with necessary information so you will have a thorough understand of exactly what is meant by breadth. A simple definition of breadth is when a group of stocks, whether in an index, a sector, or any grouping, is measured based upon the price changes of the stocks without regard to price weighting, capitalization weighting, and the magnitude of their movement.
Breadth Components
Breadth components are readily available from newspapers, online sources, etc. and consist of daily and weekly statistics. They are: Advances, Declines, Unchanged, Total Issues, Up Volume, Down Volume, Total Volume (V), New Highs, and New Lows.
From one day to the next, any issue can advance in price, decline in price, or remain unchanged. Also any issue can make a new high or a new low. Here are more specific definitions:
Advancing Issues or Advances (A) – Stocks that have increased in price from one day to the next, even if only by one cent, are considered as advancing issues or advances. A bullish market will take many, if not most, issues with it. As the market rises, the number of advances will remain fairly high with the usual oscillations as traders move in and out of the market. Most often the advancing issues will start to decline in number well before the price action reflects a market starting to peak. This is because fewer and fewer issues are continuing to rise. The prices continue to rise because most market averages are capitalization weighted and the generals continue to lead the charge.
Declining Issues or Declines (D) – Stocks that have decreased in price from one day to the next are considered declining issues or declines. It is when the declines begin to rise that the topping formation is reaching its final stages.
Unchanged Issues or Unchanged (U) – Stocks that do not change in price from one day to the next are considered unchanged issues or unchanged.
Total Issues (TI) – This is the total of all issues available for trading on a particular exchange. If you added the advances, declines, and unchanged issues together it would equal the total issues.
Advancing Volume or Up Volume (UV) – This is the volume traded on a day for each of the stocks that are advancing issues. It is the total volume of all the advances.
Declining Volume or Down Volume (DV) – This is the total volume for all the declines for a particular day.
Stocks can still advance and the amount of volume will be the first indication of a weakening advance. As an up move begins to falter, the up volume will be one of the first hints that all is not well. It is generally not the case that the declining volume will lead the declining issues when the market is in a maturing top formation. Markets can drop merely from a lack of up volume; they do not need a large increase in down volume. As a market declines, the down volume will come back into play and can be used to help identify the beginning of a bottom. The down volume will quickly dry up and the up volume will rise quickly at a market bottom.
Total Volume (V) – This is the total volume of all trading for a particular day. Total volume is the sum of Up Volume, Down Volume, and Unchanged Volume. To find Unchanged Volume subtract the sum of Up Volume and Down Volume from the Total Volume. Total volume is not generally considered a breadth component, but is many times used in a ratio with the up or down volume to alleviate the increase in trading activity over long periods of time.
New High (H) – Whenever a stock’s price reaches a new high price for the last 52 weeks it is termed a new high.
New Low (L) – Whenever a stock’s price reaches a new low price for the last 52 weeks it is termed a new low.
The new highs and the new lows are not related like the advances and declines. An advance or decline is based upon a single day’s price change. A new high or new low is based upon the previous year’s price changes. It is critically important to remember this as it is the one thing I see misunderstood the most. Daily changes in price are drastically different than yearly changes.
Author Note: As a long time momentum buyer, I tell investors that in every daily newspaper in the country they publish a list of stocks to buy each day. It is called the Stocks making New Highs list. Too many investors treat buying a stock like they are buying soap at the grocery store, they only want a bargain. When buying a consumable, you know what a bargain is; unfortunately when buying a stock you will only know it is a bargain in hindsight. Wouldn’t it make more sense (cents) to buy a stock that has already proven it can rise in price?
As previously stated, a bullish market will take many issues with it. As the market continues to rise, the number of new highs should continue to increase. Many times the new highs will surge at the beginning of a bull market, then drop off, only to return toward the end of a long bullish advance. This is because stocks that have broken out of congestion areas and rising above their resistance levels have unlimited upward potential on a technical basis. As the market’s upward move starts to falter, the first thing that happens is the number of new highs stops increasing. Then the number of new highs will begin to decline. As the topping process matures, the number of new lows will slowly begin to increase but will not do so dramatically until the market really begins to fall.
If the number of new highs begins to drop during a market advance, this is quite bearish. In a strong upward market move, even if the new highs do not continue to increase is a bearish warning. They do not have to drop in number, just the fact that they are no longer increasing is not good for the upward movement.
The NYSE new highs and new lows are now computed on a fixed 52 week moving time window starting on January 1, 1978. Before that, the new highs and new lows were computed on a variable time window of anywhere from two and a half months to 14 and a half months. This rendered the new high new low data prior to 1978 almost useless, and certainly confusing to use.
Breadth Relationships
There are basically four different indicator types: differences, ratios, percentage, and cumulative. Differences are most common and should be adjusted for time independent scaling. As the number of issues increase over time, the scaling will get expanded and thresholds that worked in the past will need to be adjusted. One way to do this is to normalize the indicator so the scaling is always between zero and one hundred.
Another group of breadth data is when you look at the numbers of issues that are above or below a threshold, such as the 200 day moving average. These breadth measures are often called the Participation Index, which shows how many stocks in a group are doing the same thing.
Often you will see the Put/Call Ratio included as a breadth measure. While it certainly qualifies based upon the simple definition of breadth, I think it is used more as a sentiment measure.
Indicator Categories
Because of the large number of breadth indicators, I classify breadth indicators into different categories based upon the mathematical relationship between the breadth pairs. An indicator pair relates to the advances and declines, the new highs and new lows, and the up volume and down volume. Pairs can be mathematically related in a number of ways. The difference between the two and the division of the two are the two primary ways these pairs have been used to create breadth indicators.
A – D AD Difference
A / D AD Ratio
AD AD Miscellaneous
H – L HL Difference
H / L HL Ratio
HL HL Miscellaneous
UV DV Volume
A D H L Composite (uses a mixture of breadth)
UV DV Composite (uses a mixture of breadth)
When necessary, the numerator controls in which category the indicator will be. If A-D is in the numerator it is in the AD Difference category. A number of indicators could be in either the difference or the ratio category. For example, the ratio used by Tom McClellan and Carl Swenlin has (A – D) in the numerator and (A + D) in the denominator (A-D) / (A+D). The numerator will usually control the direction of an indicator so that is what was used to determine the category the indicator will be in.
Changes in Breadth Over the Years
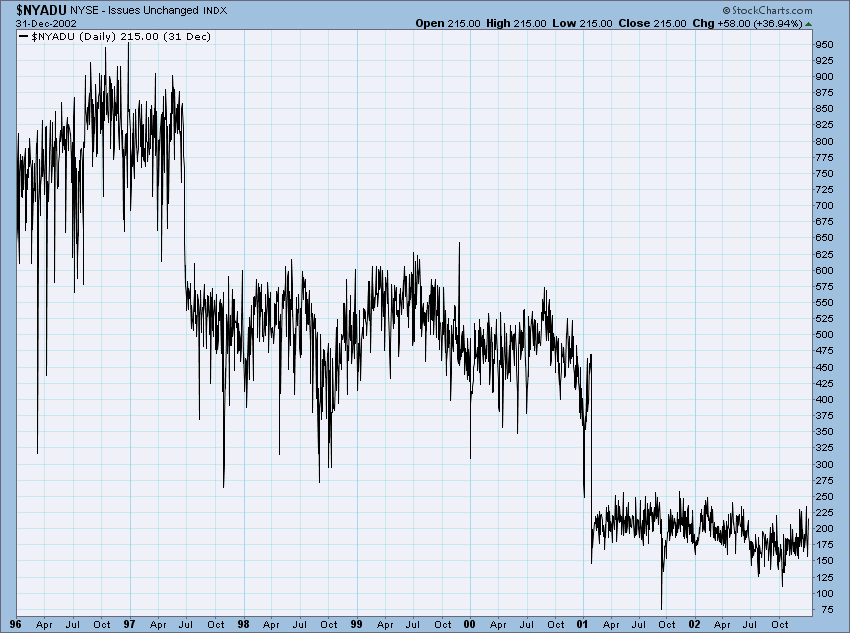
Prior to July 1997, stock prices were measured in eighths of a point, or 12.5 cents as the minimum trading unit. In July 1997 the NYSE went from using eighths to sixteenths. This made the minimum trading unit 6.25 cents. On January 29, 2001 they went to a decimalization pricing that made the minimum trading unit equal to 1 cent (a penny). When plotting the NYSE unchanged issues, these changes are clearly evident (see the chart below) because with only a penny change from one day to the next there are considerably fewer unchanged issues. However, I have not found the other breadth components to be affected as much, especially if you are always looking at measures that involve the ratio or difference.
An Example of the Value of Breadth
Market tops, also referred to as periods of distribution are usually lengthy, volatile, and extremely difficult to pinpoint the actual top except for the always 20-20 hindsight. As traders and investors watch the market action and the financial media shows the major indices every market day (every 5 minutes), you must realize that all of the major indices like the S&P 500, NYSE Composite, and Nasdaq Composite are capitalization weighted indices. The Dow Jones Industrial Average is a price weighted index and performs similarly. Capitalization and price weighted indices are controlled or driven by their largest components, let’s say the ones that make up 10% of the index can account from 35% - 45% of the indices movement. At one point the top 10 stocks in the Nasdaq 100 index accounted for 46% of its movement.
After a long bull run in the market and prices begin to become more volatile and the overall trend has been reduced, it is not uncommon for investors and traders to seek some safer holdings. These holdings are generally large-cap and blue chip stocks; they exit out of their more risky holdings such as growth and small-cap stocks. This unified action causes the capitalization weighted indices to continue to move higher as more and more investors sell the small and mid-caps for perceived safety in large-caps. Breadth on the other hand, where all stocks are created equally, will show a declining trend.
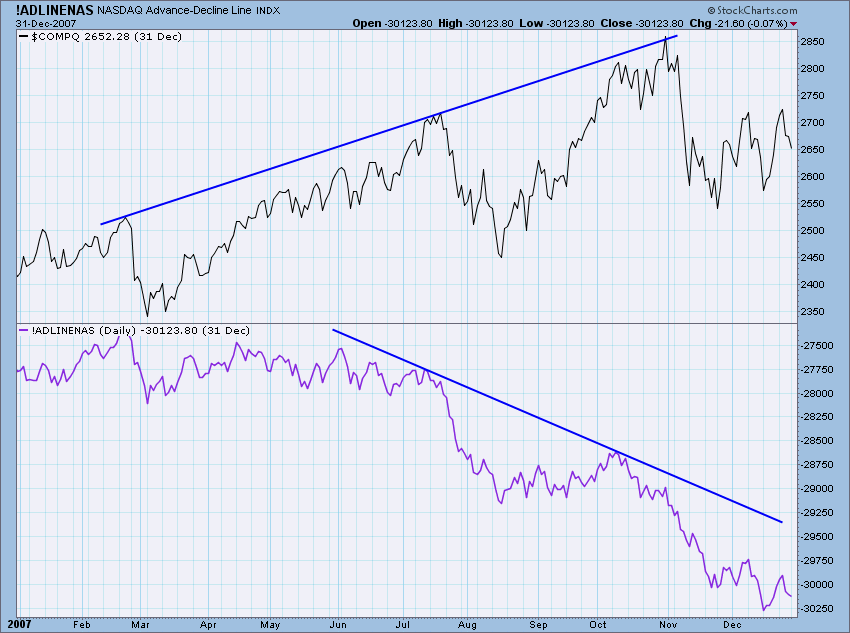
Let’s take the year 2007 as an example to show the importance that breadth contributes to market analysis. After a good bull run from early 2003, the market’s overall trend was reduced early in 2007 but still making higher highs. Breadth, using the ubiquitous advance decline line, declined during the entire year (see chart below). This is because fewer and fewer stocks were participating in the perceived rally. The Troops were no longer following the Generals. My friend Tom McClellan likes to say that breadth arrives at the party on time but always leaves early.
After using breath for decades I would state the following about breadth and market tops. Breadth can and will show deterioration (divergence) while price based indicators move higher at every market top, it also can and will display it at times when there is only a pullback or correction. One cannot assume that a divergence with price and breadth will be a trading opportunity, but it will always be a time to become more alert. This is not unlike many economic indicators, recalling the humorous adage that the Index of Leading Indicators has called 18 of the 12 recessions. Remember breadth treats all stocks equally. Exxon Mobile could be up $35.00 one day and Bubba’s Pizza could be down $0.01 and they would cancel each other out using breadth.
Hopefully this introduction to the many facets of market breadth will create an interest in the subject. Personally I think it is overlooked too often. Future articles will delve deeper into breadth indicators and their uses along with a piece I wrote years ago called “The Breadth Dance.” I wrote my book on breadth in 2006, The Complete Guide to Market Breadth Indicators; I wrote it because most of the large all-encompassing technical analysis books usually included only a chapter or less to the subject and I thought it was important enough to devote an entire book. I am currently in the process of producing a Kindle version, updating the book to the Second Edition with updated charts, including tripling the number of charts in the book. For every chart in the First Edition which used only the NYSE breadth data, there will also be the same chart using Nasdaq breadth data and one using Toronto breadth data. As I move through the production of the Second Edition I will make updates and overviews for StockCharts.com. These articles will be made based upon the progress of the book and not based upon a predetermined frequency.
- Greg Morris