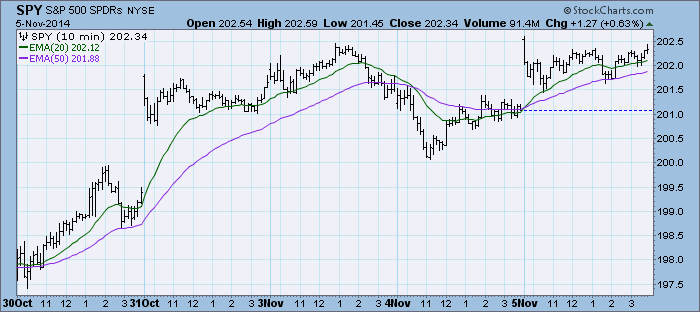
The market was up all day making new all-time highs, but still spent the majority of the day moving sideways.
The purpose of the DecisionPoint Daily Update is to quickly review the day's action, internal condition, and Trend Model status of the broad market (S&P 500), the nine SPDR Sectors, the U.S. Dollar, Gold, Crude Oil, and Bonds. To ensure that using this daily reference will be quick and painless, we are as brief as possible, and often we let a chart speak for itself.
SIGNALS: Here we include the current day's signal table, an excerpt from the DecisionPoint Alert Daily Report.
DECISIONPOINT ALERT DAILY REPORT
Wednesday, 11/5/2014

************************ DECISIONPOINT MARKET POSTURE ***********************

The following is the market posture suggested by our mechanical trend-
following tools. These are not trading recommendations, rather they are price
activity flags that should be qualified by chart analysis. The Trend Model is
used on all indexes.


                                     Days   Index     11/05   Points  Percent
Index               Posture     Date Elap  @Start     Close      P/L      P/L
------------------- ------- -------- ---- -------   -------  -------  -------
Stocks Medium-Term  Bullish 10/31/14    5   201.66   202.34    +0.68    +0.3%
Stocks Long-Term    Bullish 10/31/14    5   201.66   202.34    +0.68    +0.3%
Gold (NY Spot)      Bearish 08/21/14   76  1275.40  1145.70  +129.70   +10.2%
20+Yr T-Bond  (TLT) Bullish 01/17/14  292   102.88   119.16   +16.28   +15.8%
------------------- ------- -------- ---- -------   -------  -------  -------
Dollar Index  (UUP) Bullish 07/21/14  107    21.47    23.25    +1.78    +8.3%
Commodities   (GSG) Neutral 07/14/14  114    32.64    27.32     ....     ....
Crude Oil     (USO) Neutral 07/30/14   98    36.92    29.95     ....     ....
------------------- ------- -------- ---- -------   -------  -------  -------
S&P 500       (SPY)     BUY 10/31/14    5   201.66   202.34    +0.68    +0.3%
S&P Equal Wt  (RSP)     BUY 11/03/14    2    78.10    78.31    +0.21    +0.3%
Dow           (DIA)     BUY 10/31/14    5   173.45   174.55    +1.10    +0.6%
Nasdaq 100    (QQQ)     BUY 10/29/14    7    99.81   101.37    +1.56    +1.6%
NDX Equal Wt (QQEW)     BUY 10/30/14    6    40.66    41.35    +0.69    +1.7%
S&P 100       (OEF)     BUY 10/31/14    5    89.75    90.02    +0.27    +0.3%
S&P 400 MidCp (IJH)     BUY 11/05/14    0   141.76   141.76 * Changed Today *
S&P 600 SmlCp (IJR)     BUY 11/03/14    2   111.40   111.27    -0.13    -0.1%
Total Market  (VTI)     BUY 11/03/14    2   104.08   104.19    +0.11    +0.1%
Consumer Disc (XLY)     BUY 11/05/14    0    67.55    67.55 * Changed Today *
Cons Disc EWt (RCD)     BUY 11/03/14    2    82.86    82.22    -0.64    -0.8%
Consumer Stpl (XLP)     BUY 08/20/14   77    44.59    47.47    +2.88    +6.5%
Cons Stpl EWt (RHS)     BUY 10/21/14   15    98.15   101.90    +3.75    +3.8%
Energy        (XLE) Neutral 09/08/14   58    95.08    85.75     ....     ....
Energy EWt    (RYE) Neutral 09/08/14   58    87.04    75.94     ....     ....
Financial     (XLF)     BUY 10/29/14    7    23.44    24.10    +0.66    +2.8%
Financial EWt (RYF)     BUY 10/30/14    6    42.64    43.62    +0.98    +2.3%
Health Care   (XLV)     BUY 10/23/14   13    64.31    67.29    +2.98    +4.6%
Health Cr EWt (RYH)     BUY 05/09/14  180   115.95   137.26   +21.31   +18.4%
Industrial    (XLI)     BUY 10/30/14    6    54.67    55.45    +0.78    +1.4%
Industrl EWt  (RGI)     BUY 10/31/14    5    87.96    88.53    +0.57    +0.6%
Materials     (XLB) Neutral 10/06/14   30    48.43    48.02     ....     ....
Materials EWt (RTM) Neutral 10/02/14   34    81.60    81.77     ....     ....
Technology    (XLK)     BUY 10/31/14    5    40.54    40.81    +0.27    +0.7%
Technolgy EWt (RYT)     BUY 11/04/14    1    87.51    88.08    +0.57    +0.7%
Utilities     (XLU)     BUY 08/28/14   69    42.62    46.56    +3.94    +9.2%
Utilities EWt (RYU)     BUY 08/20/14   77    71.92    78.20    +6.28    +8.7%

Average                                25                               +3.0%
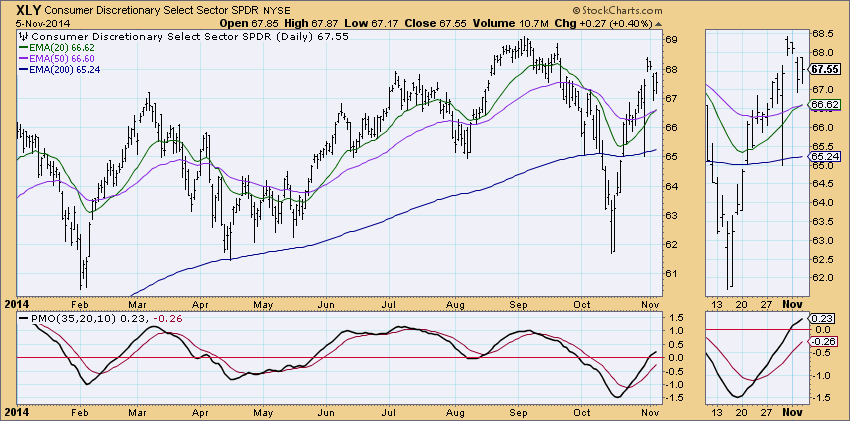
Today saw two more Trend Model signal changes as the 20-EMA crossed above the 50-EMA on the SP400 ETF (IJH) and the Consumer Discretionary ETF (XLY). There are only four more ETFs that are on Neutral signals on our DP Alert Daily Report.

NOTE: Mechanical trading model signals define the implied bias of the price index based upon moving average relationships, but they do not necessarily call for a specific action. They are information flags that should prompt chart review. Further, they do not call for continuous buying or selling during the life of the signal. For example, a BUY signal will probably return the best results if action is taken soon after the signal is generated. Additional opportunities for buying may be found as price zigzags higher, but the trader must look for optimum entry points. Conversely, exit points to preserve gains (or minimize losses) may be evident before the model mechanically closes the signal.
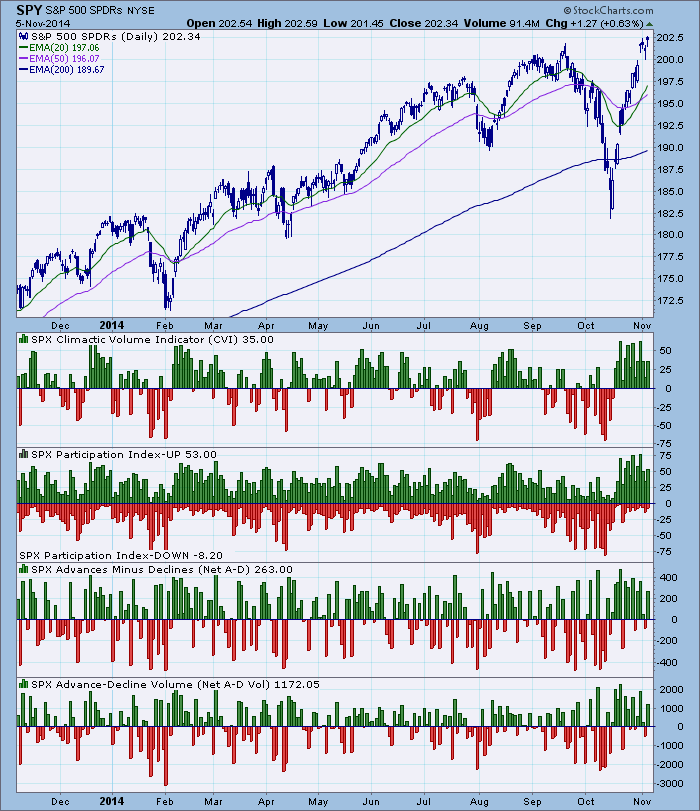
STOCKS: Based upon a 10/31/2014 Trend Model BUY signal, our current intermediate-term market posture for the S&P 500 (SPY) is bullish. The Trend Model, which informs our long-term outlook, is on a BUY signal as of 10/31/2014 so our long-term posture is bullish.
Price hit new all-time highs again. There was a slight breakout above horizontal resistance at the September high. Even a significant breakout will only bring price to medium-term resistance along the rising tops line. The PMO is still rising strongly but has just about put its toes in overbought territory.

Ultra-Short-Term Indicators: If it weren't for the climactic readings of the past two weeks, today's would be considered much more climactic than they appear. Readings today are climactic. Given that price seems to be having some difficulty breaking out significantly above the September high, I suspect this might be an ultra-short-term exhaustion climax. However, if you've been reading this update regularly, you'll know that making a 'call' on which type of climax (initiation or exhaustion) isn't an exact science, it's opinion.
Short-Term Indicators: These indicators turned back up in very overbought territory. These indicators still need to relieve overbought conditions and that will be difficult if price doesn't pullback or at least consolidate.
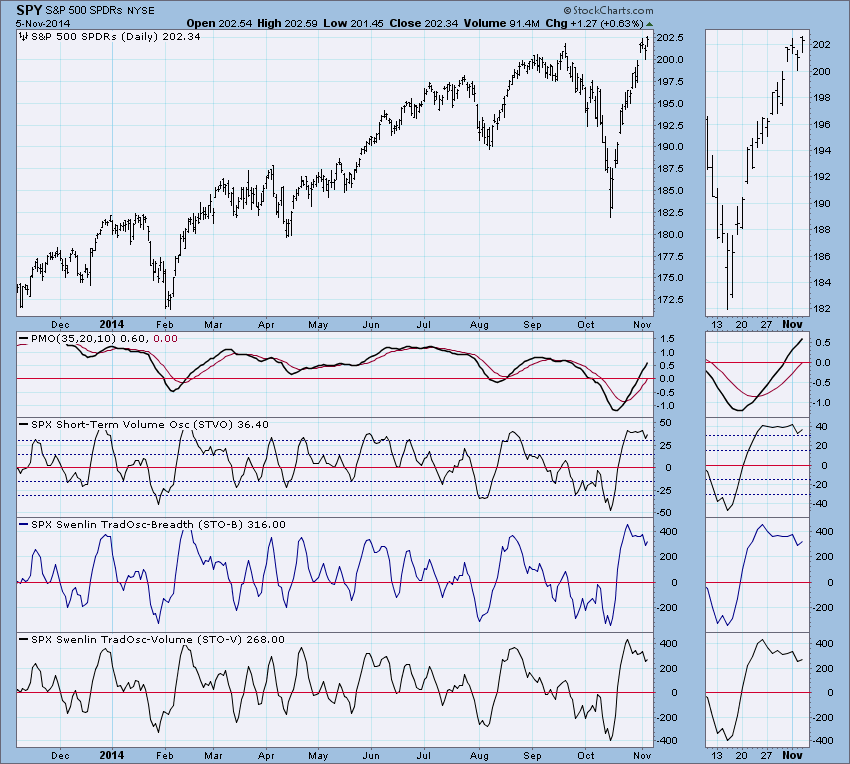
Intermediate-Term Indicators: The VTO had turned down, but today switched direction to join the ITBM and ITVM which have been rising uninterrupted since the bottom of the correction. This is bullish.

Conclusion: Price has been unable to breakout significantly past near-term resistance and even stronger resistance at the rising tops line is looming. Ultra-short-term and short-term indicators are bearish. However, intermediate-term indicators are still very bullish. Given this, we should see a pullback or possibly more struggle to breakout above resistance. The concern with intermediate-term indicators is they are getting overbought. But ultimately, until they turn down, they tell us that the bull market should continue.
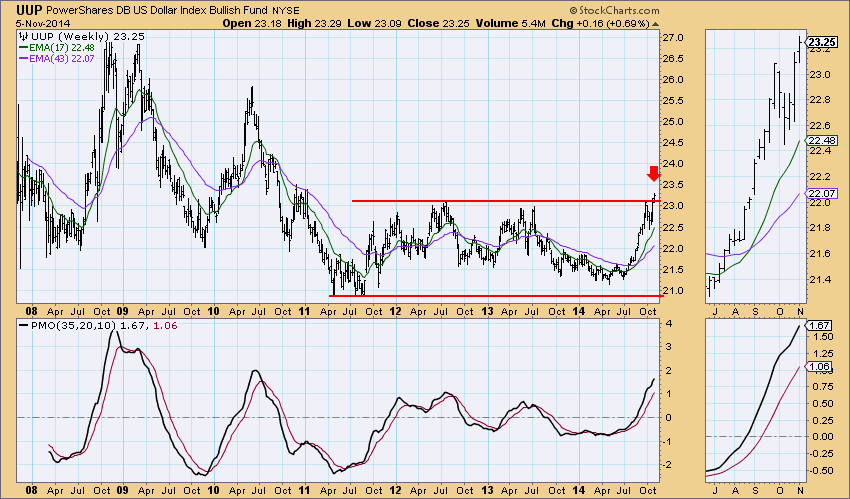
DOLLAR: As of 7/21/2014 the US Dollar Index ETF (UUP) is on a Trend Model BUY signal. The LT Trend Model, which informs our long-term outlook, is on a BUY signal as of 8/21/2014, so our long-term posture is bullish.
The weekly chart has not gone final, but it shows the big picture. We can see that prices are staying above long-term resistance.
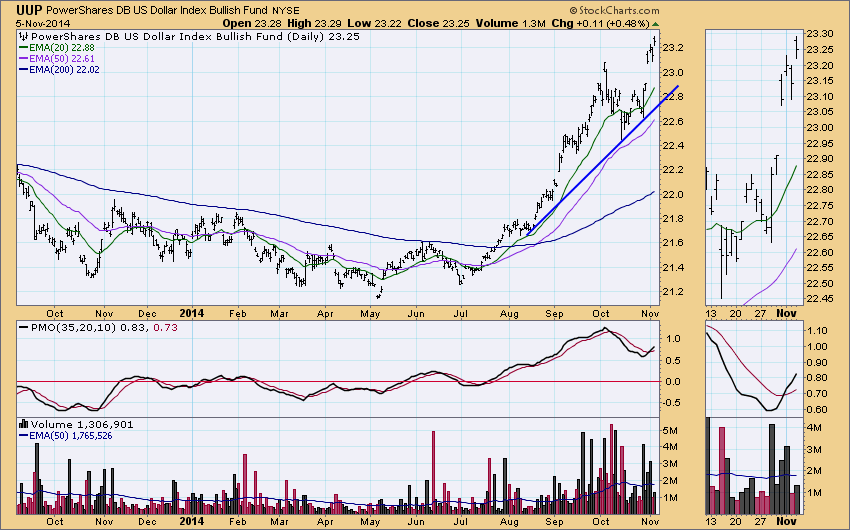
A look at the daily and you can see the PMO is still rising and price doesn't seem interested in a decline.
GOLD: As of 8/21/2014 Gold is on a Trend Model SELL signal. The LT Trend Model, which informs our long-term outlook, is on a SELL signal as of 2/15/2013, so our long-term posture is bearish.
Today the reverse flag executed. To determine the minimum downside target, you measure the length of the flag pole and then subtract that from the price at the bottom of the flag. This would put the minimum downside target all the way down to 1085.

CRUDE OIL (USO): As of 7/30/2014 United States Oil Fund (USO) is on a Trend Model NEUTRAL signal. The LT Trend Model, which informs our long-term outlook, is on a SELL signal as of 8/28/2014, so our long-term posture is bearish.
Like gold, USO's bearish reverse flag executed on Monday. Today saw a snap back to the area of the breakdown, but resistance held so I would expect the decline to continue.

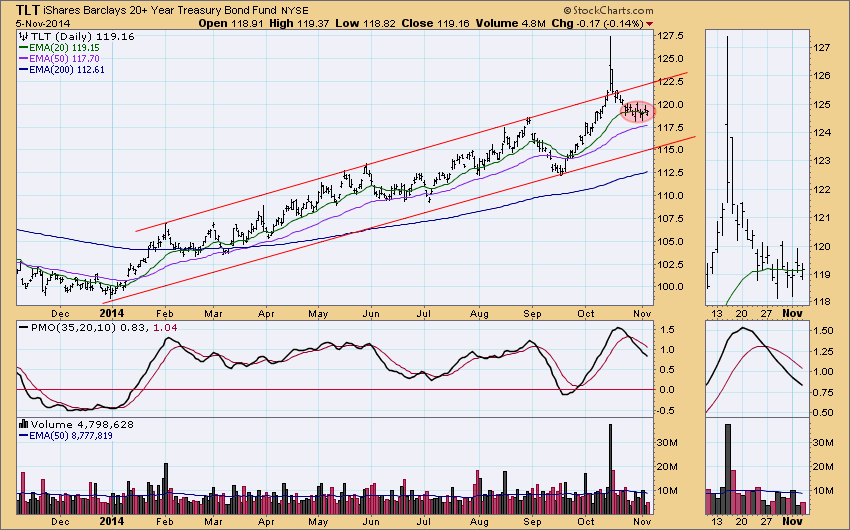
BONDS (TLT): As of 1/17/2014 The 20+ Year T-Bonds ETF (TLT) is on a Trend Model BUY signal. The LT Trend Model, which informs our long-term outlook, is on a BUY signal as of 3/24/2014, so our long-term posture is bullish.
Bond prices have been consolidating for some time. Price has been wrapping around the 20-EMA. The 50-EMA is the next area of near-term support. However, the PMO is falling and suggests that price will probably test the bottom of the rising trend channel.
Technical Analysis is a windsock, not a crystal ball.
- Erin