The Nasdaq 100 lost its Intermediate-Term Trend Model (ITTM) BUY signal yesterday, so it wasn't a total surprise to see the QQQ and QQEW (equal-weight version of NDX) lose theirs today. What is interesting, is that QQEW moved to an ITTM SELL signal versus the NDX and QQQ which switched to ITTM Neutral Signal. This is due to the fact that QQEW is technically in a bear market configuration. My recent ChartWatchers article made comparisons between QQQ and QQEW, equal-weight versus cap-weighted.
Below is an excerpt from the DecisionPoint Market/Sector Summary. These two ETFs follow the Technology ETF (XLK) in losing ITTM BUY signals. One thing that is important to point out, when we start moving into a bear market, this market posture table will begin to "flip". The BUY signals will begin to move to Neutrals and SELLs. This is likely only the beginning.
DECISIONPOINT MARKET/SECTOR SUMMARY DAILY REPORT
Thursday, 5/12/2016

************************ DECISIONPOINT MARKET POSTURE *************************************

The following is the market posture suggested by our mechanical trend-
following tools. These are not trading recommendations, rather they are price
activity flags that should be qualified by chart analysis. The Trend Model is
used on all indexes.


                                     Days   Index     05/12   Points  Percent   Prev Signal
Index               Posture     Date Elap  @Start     Close      P/L      P/L     P/L  Days
------------------- ------- -------- ---- -------   -------  -------  ------- ------- -----
Stocks Medium-Term  Bullish 03/07/16   66   199.56   206.56    +7.00    +3.5%
Gold (NY Spot)      Bullish 01/25/16  108  1108.10  1271.20  +163.10   +14.7%
20+Yr T-Bond  (TLT) Bullish 12/11/15  153   122.53   131.01    +8.48    +6.9%
------------------- ------- -------- ---- -------   -------  -------  ------- ------- -----
Dollar Index  (UUP) Neutral 02/05/16   97    25.17    24.38     ....     ....
Commodities   (GSG) Bullish 03/16/16   57    14.19    15.18    +0.99    +7.0%
Crude Oil     (USO) Bullish 04/12/16   30    10.64    11.45    +0.81    +7.6%
------------------- ------- -------- ---- -------   -------  -------  ------- ------- -----
S&P 500       (SPY)     BUY 03/07/16   66   199.56   206.56    +7.00    +3.5%
S&P Equal Wt  (RSP)     BUY 03/04/16   69    76.02    78.92    +2.90    +3.8%
Dow           (DIA)     BUY 03/07/16   66   170.13   177.42    +7.29    +4.3%
Nasdaq 100    (QQQ) Neutral 05/12/16    0   105.89   105.89 * Changed Today *   -1.3%    57
NDX Equal Wt (QQEW)    SELL 05/12/16    0    40.67    40.67 * Changed Today *   -2.0%    59
S&P 100       (OEF)     BUY 03/08/16   65    88.01    91.96    +3.95    +4.5%
S&P 400 MidCp (IJH)     BUY 03/04/16   69   139.42   145.28    +5.86    +4.2%
S&P 600 SmlCp (IJR)     BUY 03/07/16   66   109.96   112.02    +2.06    +1.9%
Total Market  (VTI)     BUY 03/08/16   65   100.54   105.33    +4.79    +4.8%
Consumer Disc (XLY)     BUY 03/08/16   65    75.48    79.05    +3.57    +4.7%
Cons Disc EWt (RCD)     BUY 03/03/16   70    85.54    84.12    -1.42    -1.7%
Consumer Stpl (XLP)     BUY 01/29/16  104    50.50    53.92    +3.42    +6.8%
Cons Stpl EWt (RHS)     BUY 01/29/16  104   115.02   124.44    +9.42    +8.2%
Energy        (XLE)     BUY 03/09/16   64    60.31    65.83    +5.52    +9.2%
Energy EWt    (RYE)     BUY 03/10/16   63    46.90    53.01    +6.11   +13.0%
Financial     (XLF)     BUY 03/17/16   56    22.51    23.16    +0.65    +2.9%
Financial EWt (RYF)     BUY 03/15/16   58    40.85    42.91    +2.06    +5.0%
Health Care   (XLV)     BUY 03/31/16   42    67.78    69.30    +1.52    +2.2%
Health Cr EWt (RYH)     BUY 03/31/16   42   144.31   146.25    +1.94    +1.3%
Industrial    (XLI)     BUY 02/29/16   73    51.85    55.75    +3.90    +7.5%
Industrl EWt  (RGI)     BUY 02/29/16   73    81.51    87.95    +6.44    +7.9%
Materials     (XLB)     BUY 03/03/16   70    42.81    46.40    +3.59    +8.4%
Materials EWt (RTM)     BUY 03/01/16   72    75.57    84.27    +8.70   +11.5%
Technology    (XLK) Neutral 05/11/16    1    42.49    42.37     ....     ....
Technolgy EWt (RYT)     BUY 03/07/16   66    90.03    89.84    -0.19    -0.2%
Utilities     (XLU)     BUY 12/28/15  136    43.23    49.63    +6.40   +14.8%
Utilities EWt (RYU)     BUY 12/24/15  140    72.31    83.17   +10.86   +15.0%

Average                                65                               +6.0%
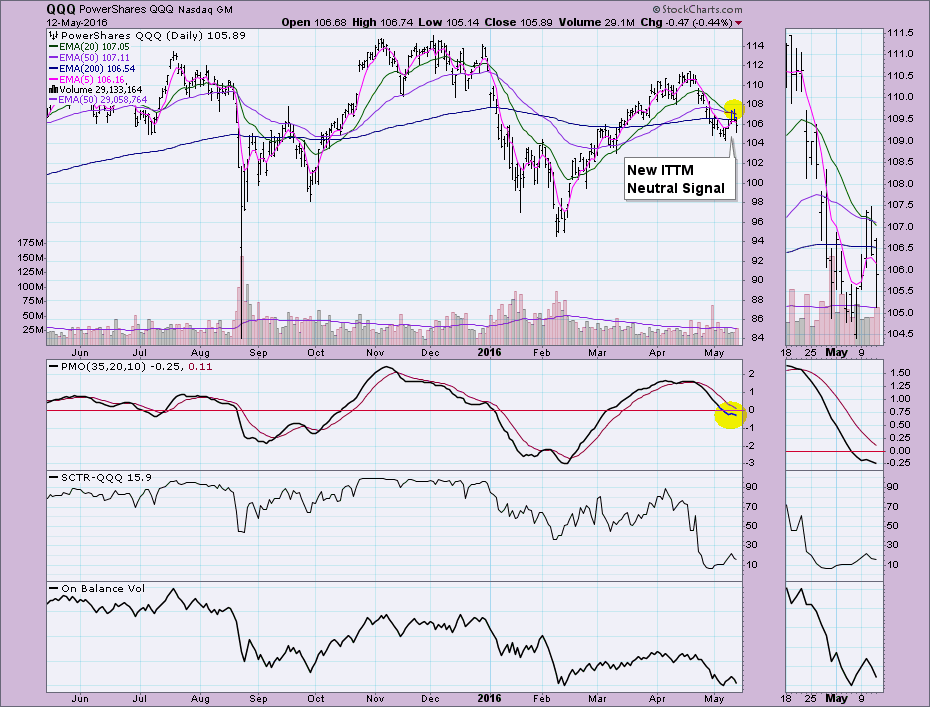
We'll start with QQQ.
The QQQ ETF which obviously follows the NDX closely, initiated an Intermediate-Term Trend Model Neutral signal today when the 20-EMA crossed below the 50-EMA. It is a Neutral signal because the crossover occurred above the 200-EMA. Essentially, while the 50-EMA is above the 200-EMA, that issue is considered to be in a bull market configuration. Our models stay with Neutral signals in a bull market configuration. The PMO is in negative territory and falling. The SCTR, which was already unhealthy, has turned down. Note the curl downward on the 5-EMA below the 200-EMA. I see nothing bullish about QQQ except that the 50-EMA is above the 200-EMA. Support is available around 104, but given the bearishness of the chart, I would expect that short-term area of support to be broken. The September 2015 low could provide support at around 98.
For the equal-weight version, QQEW, the signal that was generated was a SELL signal. The 20-EMA crossed below the 50-EMA while the 50-EMA was below the 200-EMA. This constitutes a SELL signal rather than a Neutral signal like the one on the QQQ in the chart above. The 50-EMA is below the 200-EMA, so QQEW is technically in a bear market. Therefore, a negative 20/50-EMA crossover is a SELL signal. The PMO is configured similarly, in negative territory and falling. It's about ready to test support around 40. If that fails, QQEW does have mid-term support at the September 2015 low around 39.
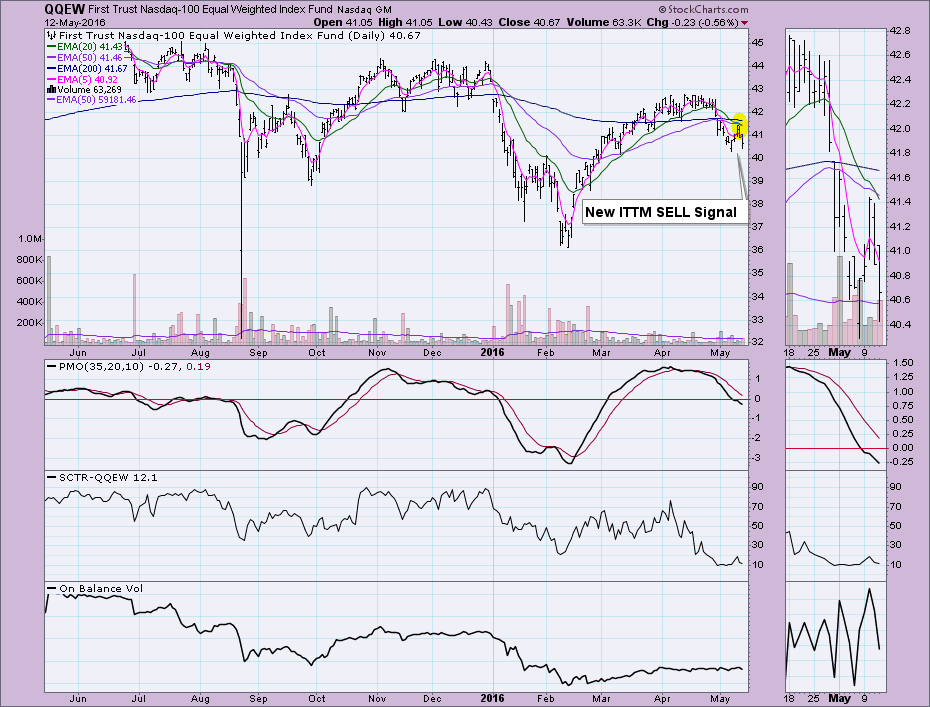
Conclusion: Clearly the equal-weight version of the NDX is more bearishly configured given the bull market versus bear market configuration of the ETFs. As I noted in my ChartWatchers article, the equal-weight ETFs seem to suffer more in a downtrend, but offer better long-term gains on price rises. Given the negative momentum on both QQQ and QQEW, as well as anemic SCTR values, I would expect price to decline past short-term support.
Come check out the DecisionPoint Report with Erin Heim on Wednesdays and Fridays at 7:00p EST, a fast-paced 30-minute review of the current markets mid-week and week-end. The archives and registration links are on the Homepage under “What’s New”.
Technical Analysis is a windsock, not a crystal ball.
Happy Charting!
- Erin