On the Friday ahead of the Brexit vote I made an assessment of the market condition and speculated as to what affect it might have on market action the next week. My conclusion was that the technicals were negative and would tend to weigh on the market regardless of direction. I suppose that was worth knowing, but I must admit that it was kind of lost in the volatile price movement that followed.
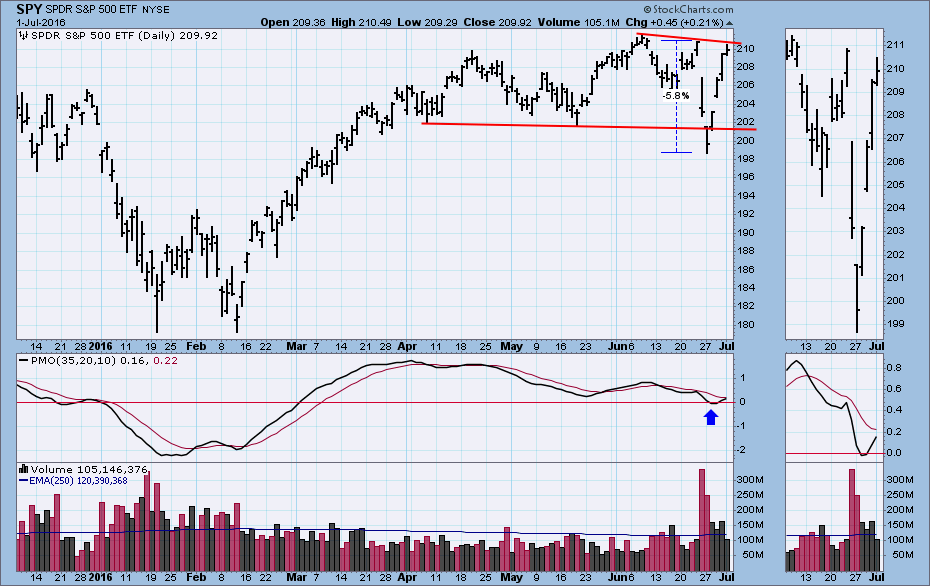
There was a two-day decline of almost -6%, then a two-day rally taking prices to nearly as high as they were before the vote. When price broke down through the horizontal support, I thought that the heart of the bull market had finally been pierced by an arrow; however, the four-day rally quickly erased that thought. In fact, the short decline and subsequent rally are pretty strong evidence that the market is still not ready to give up the ghost.
The PMO has bottomed near the zero line, which is positive and implies a continuation of the rally. My only complaint here is that the PMO never got really oversold as it did earlier this year. This could tend to shorten the rally.
Now let's use our moving average analysis to get a quick look at market condition in three time frames.
Stocks Above 200EMA: The longer-term negative divergence is still there, although, there is no negative divergence on the more recent data shown in the thumbnail. The market is modestly overbought in this time frame, but it still has room to move higher.
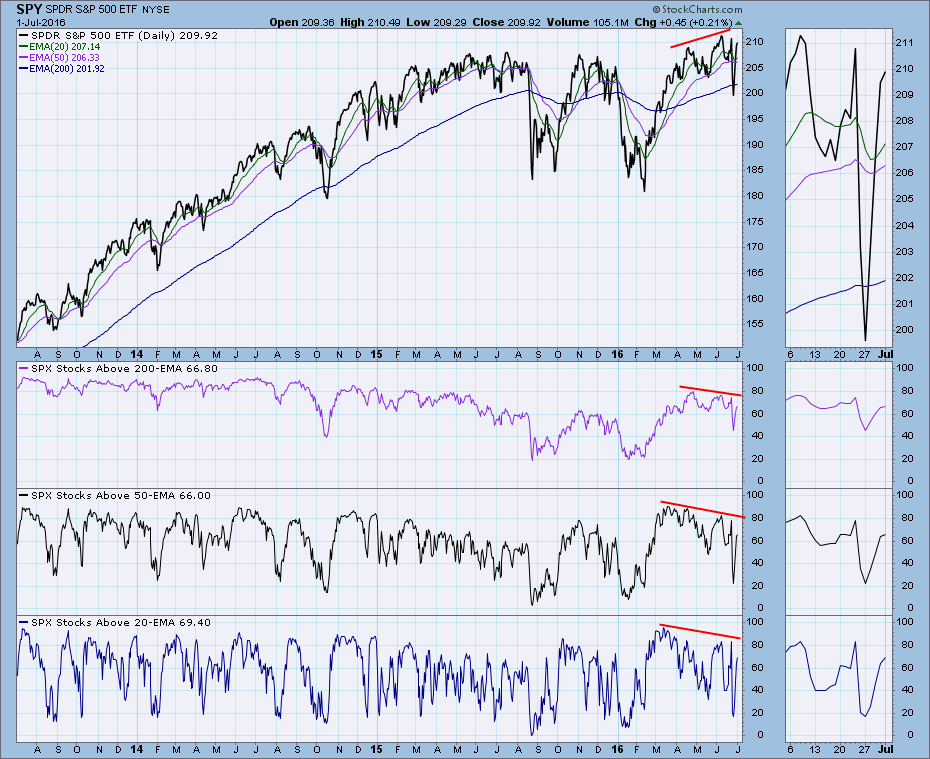
Stocks Above 50EMA and 20EMA: Other than representing shorter time frames, they are virtually the same as Stocks Above 200EMA.
CONCLUSION: The market had a very good excuse to correct down to at least the January-February lows, but it didn't. Instead, it is approaching all-time highs again. The market condition in the short-to-long time frames is modestly overbought, but there is plenty of room for the rally to continue. The immediate obstacle to that would be the overhead resistance of the all-time highs.
Technical analysis is a windsock, not a crystal ball.