After its latest quarterly earnings report, traders rushed into priceline.com (PCLN) as it surged nearly 100 dollars from 1283.99 to 1382.61 on a post-earnings gap. Patient traders, however, have seen PCLN return to its pre-earnings level as it closed on Friday at 1283.80 just seven trading days later. Perhaps the better news is that PCLN broke out of an inverse head & shoulders pattern on its weekly chart and recent weakness has provided a potential retest of the breakout level. The selling has also helped to unwind overbought oscillators on its daily chart (only weekly chart shown below). Take a look:
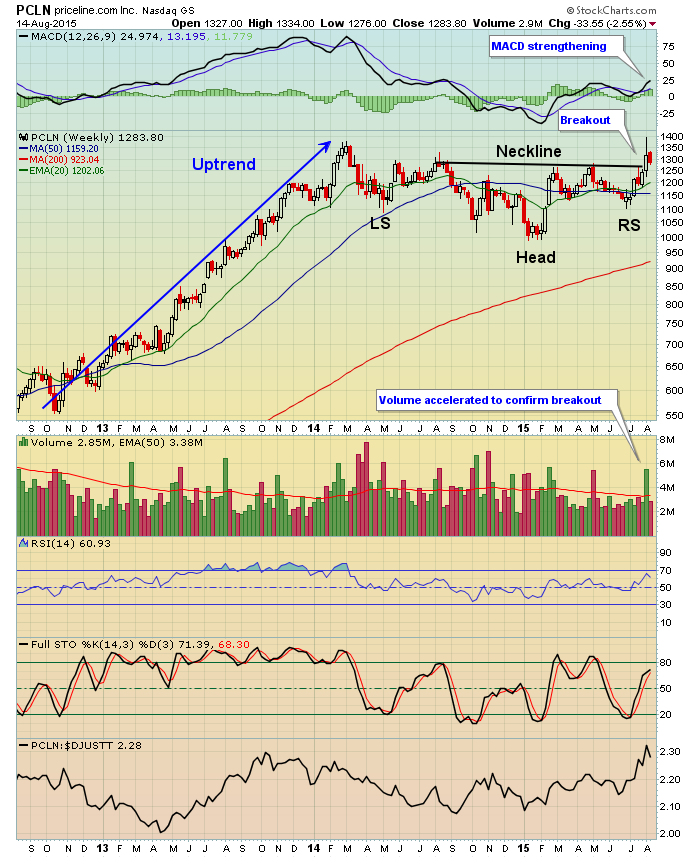
The MACD on PCLN also seems to be showing improving strength and upside momentum acceleration. Finally, PCLN is again outperforming its peers as it did in 2013, when its stock price surged.
Happy trading!
Tom
