TAKEAWAYS
- DHI's stock plummeted after missing Wall Street's earnings expectations and soft guidance
- Technical indicators provide a clearer view for those looking to buy the dip
- You can use StockCharts seasonality charts to provide a big-picture context to your trading setup

The tight supply environment in the housing market largely fueled DR Horton's (DHI) strong year-and-a-half run. Last week, DHI's earnings took a hit, missing the mark on Wall Street's profit expectations (though it managed to beat on revenue), in addition to signaling softer quarters ahead.
DHI's stock dropped from its all-time high of $157.93 to a low of $138.83 before recovering. But is it a buyable dip? Or is it a falling knife waiting to snare the unwary? Let's look at DHI stock's daily chart to find out (see below).
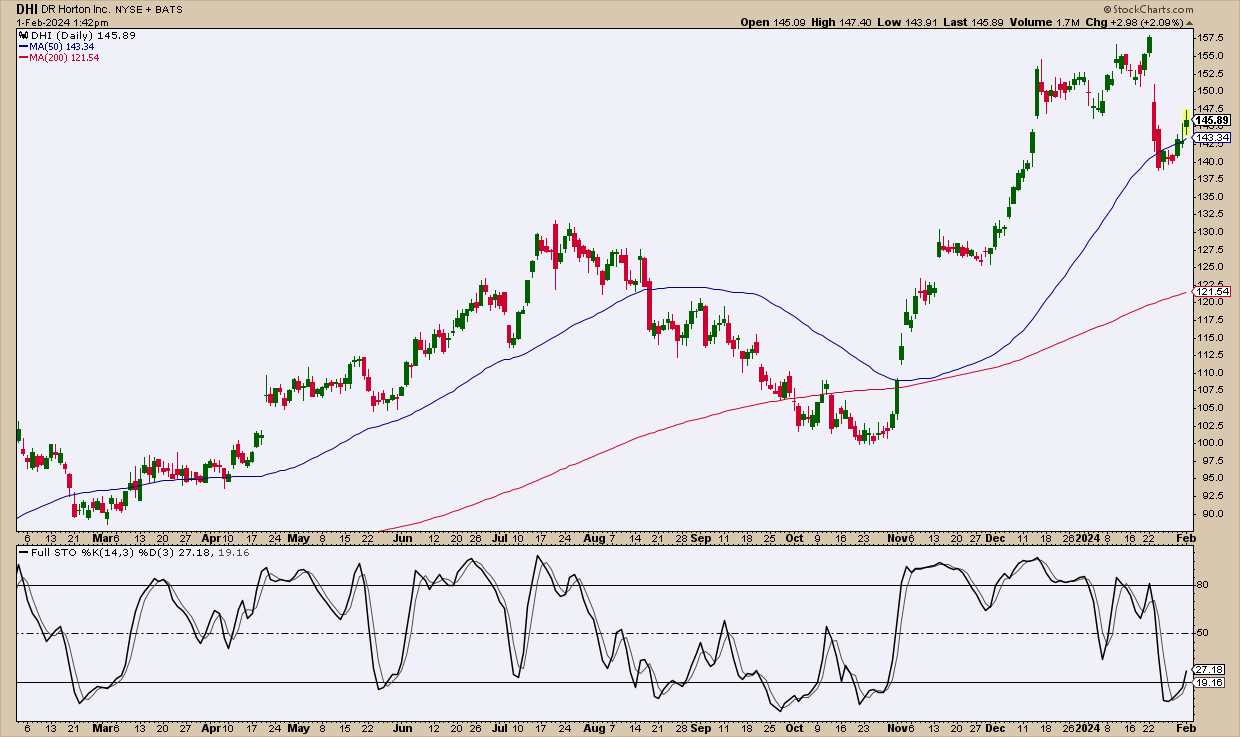
CHART 1. DAILY CHART OF DR HORTON. Buyers jumped in as soon price began consolidating below the 50-day SMA line.Chart source: StockCharts.com. For educational purposes.
The story here is pretty clear:
- DHI fell below the 50-day simple moving average (SMA), and buyers jumped in, assuming the dip was sufficient to signal a buy.
- The Stochastic Oscillator is one indicator that confirms the "oversold" thesis.
- Plus, the 50-day and 200-day SMA are trending upward, with the 50 well above the 200. Both are signaling bullishness.
While this makes for a reasonable "buy-the-dip" thesis, it could use plenty of fine-tuning by filtering it across different, yet complementary indicators.

Helpful Charting Tip
DHI was filtered in the StockCharts' Entered Ichimoku Cloud scan, an excellent way to find potential "buy the dip" stocks. Check it against the StockCharts Technical Rankings (SCTR) score (and, of course, the chart itself) to see if it's a tradable prospect.
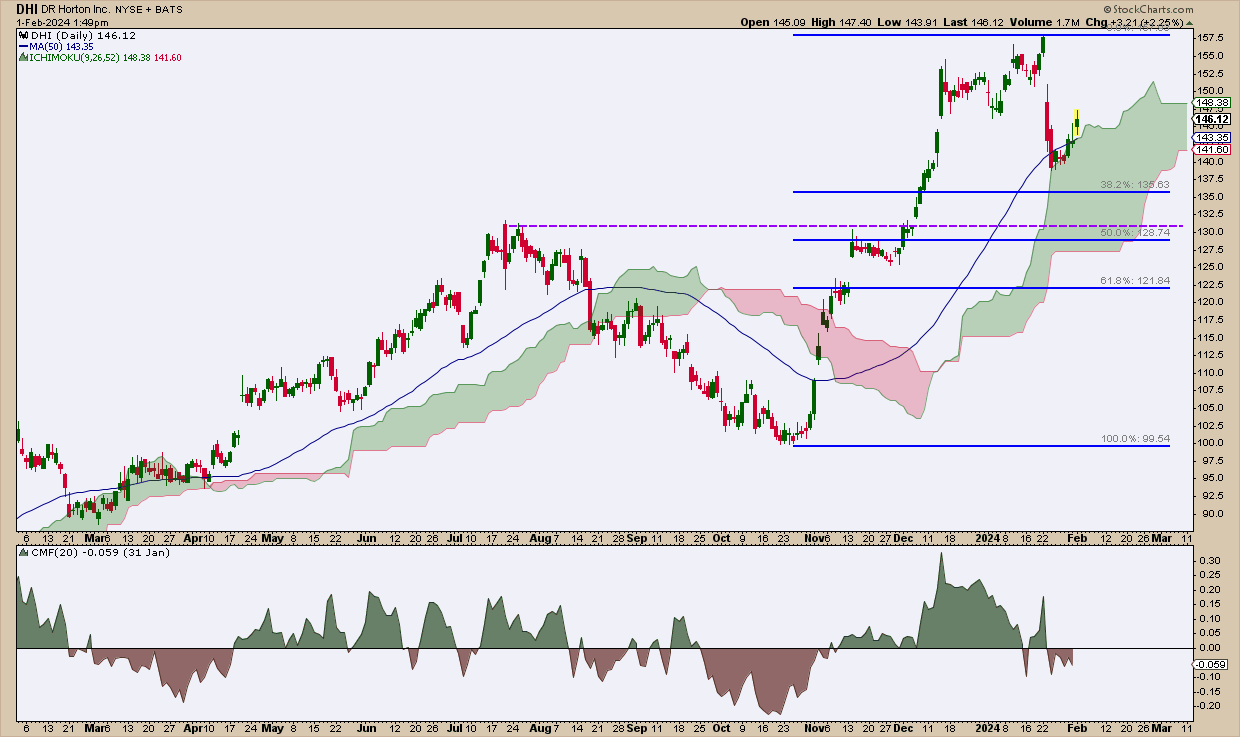
CHART 2. DAILY CHART OF DR HORTON WITH ICHIMOKU CLOUD AND CHAIKIN MONEY FLOW. Adding more indicators to measure the pullback and momentum can give you different angles to understanding the "buy the dip" scenario.Chart source: StockCharts.com. For educational purposes.
Compare the above chart to Chart 1 and decide whether an entry on the buy side might have been premature.
- Countering the "oversold" reading on the Stochastic Oscillator, the Chaikin Money Flow shows a dramatic decline in buying momentum.
- The Ichimoku Cloud indicates a bullish condition, yet gives the stock a much wider range of support than, say, the 50-day SMA; still, it helps to pinpoint a more specific entry level.
- The purple line marks a resistance level likely to serve as support.
- That potential support level also sits right above the Fibonacci 50% retracement line, which, in turn, sits right above the lowest level of the cloud.
But are there other technical reasons to support the case that DHI might have more downside to run before reversing upward? The answer is yes if you look at DHI from a seasonality context.
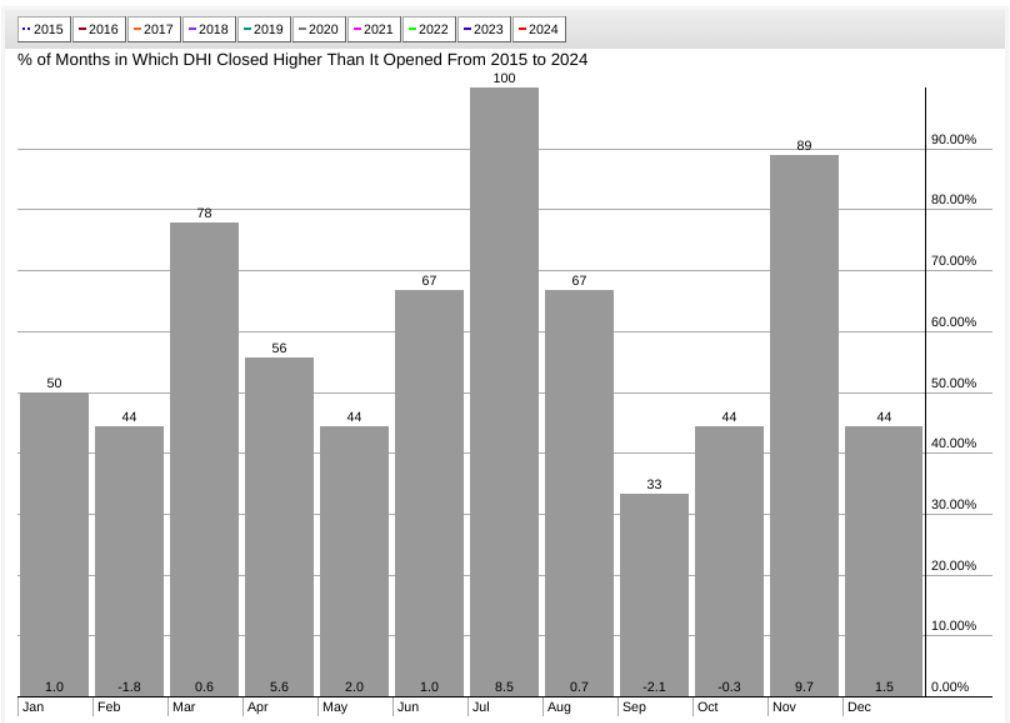
CHART 3. 10-YEAR SEASONALITY CHART FOR DHI. April, July, and November are DHI's strongest months.Chart source: StockCharts.com. For educational purposes.
DHI's 10-year seasonal performance shows that February is a weak month for the stock. While March has a strong higher close rate (78%), its average 10-year return is 0.6%. April, however, has an above-average higher-close rate and a strong average seasonal return of 5.6%. The strongest months are July (with a 100% higher close rate and 8.5% average return) and November (89% higher closes and 9.7% average return).
But how might DHI's performance compare with the S&P 500's seasonal performance?
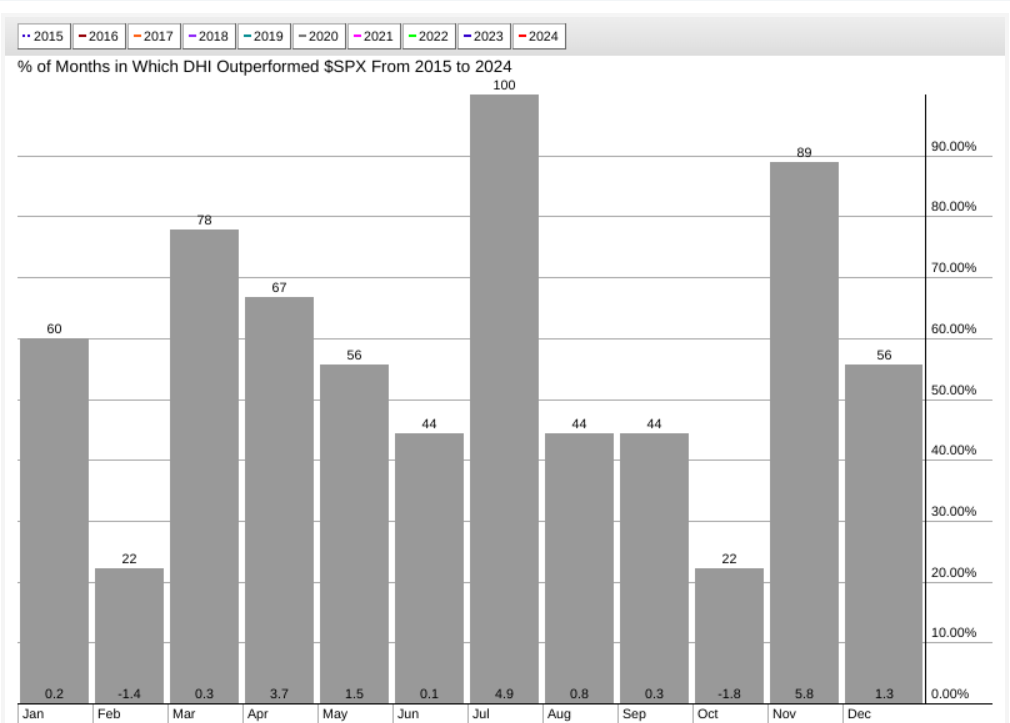
CHART 4. 10-YEAR SEASONAL PERFORMANCE OF DHI VS THE S&P 500. Though the numbers may vary against the broader market, DHI's strong months remain consistent.Chart source: StockCharts.com. For educational purposes.
The performance, though slightly varied, still reflects the same scenario: February is a weak month, while April shows strength, and July and November are the strongest months.
The Bottom Line
Considering DHI's 10-year seasonal performance, by itself and against the broader market, suggests that its current dip isn't quite over yet. The CMF shows a decline in buying pressure and doesn't indicate significant bullish momentum. Adding the Ichimoku Cloud, Fib retracements, and simple support and resistance to the mix can help traders identify favorable entry points. So, it's a matter of waiting. But the context for a trade setup is well in place.

Disclaimer: This blog is for educational purposes only and should not be construed as financial advice. The ideas and strategies should never be used without first assessing your own personal and financial situation, or without consulting a financial professional.