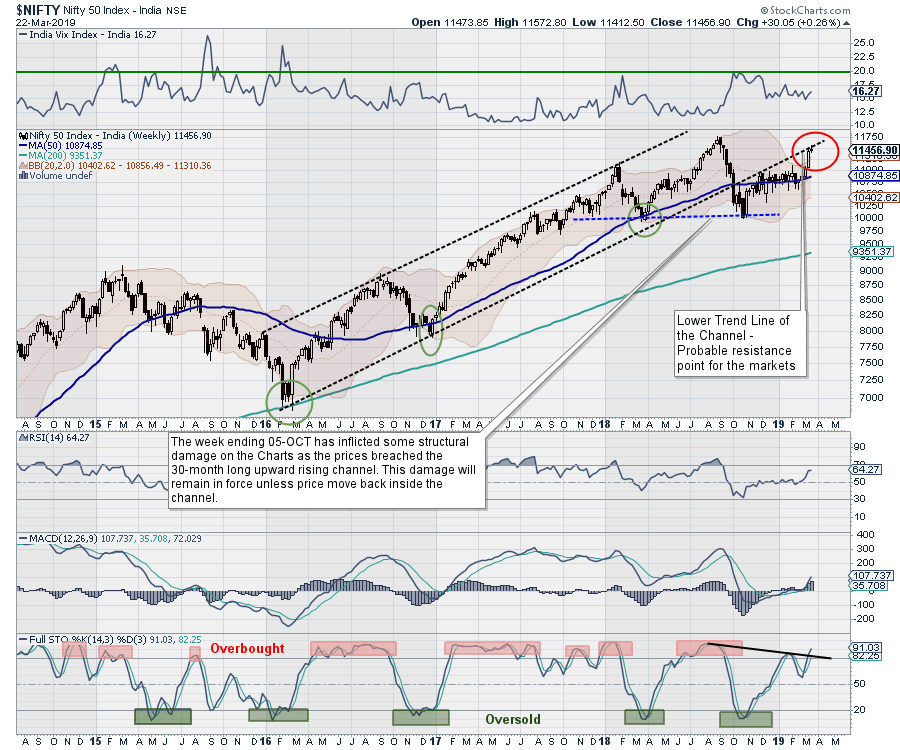
Following an unabated up move over the last several days, the markets finally took a breather on the last trading day of the week. After the session on Friday, the NIFTY has displayed visible signs of consolidation creeping in to the markets, which had become steeply overbought on the daily charts. As the week ended, it also highlighted the major resistance area for the markets on the weekly chart, in the form of the lower trend line of the 30-month-old upward rising channel that the NIFTY broke on the downside.
In our previous weekly note, we had categorically recommended putting prudence before greed and avoiding blindly chasing the up moves. Correspondingly, the NIFTY saw a paring of over 140 points from the week’s high, ending the week with net gain of just 30.05 points (+0.26%).
The markets, on both daily and weekly charts, have shown very evident signs of fatigue. In the coming week, we expect minor corrective moves to persist, while 11580-11620 will act as an important resistance zone for the markets. The expiry of the current derivative series in the coming week will also bring volatility to the trade.
We expect the levels of 11620 and 11690 to act as resistance points. Supports are expected to come lower at the 11420 and 11320 zones.
The weekly RSI is 64.2665, which has bullishly marked a fresh 14-period high. The RSI does not show any divergence against the price. The weekly MACD is bullish and continues to trade above its signal line.
A Doji occurred on the candles. This development, along with a large black body on the daily chart, shows that the NIFTY is finding it difficult to maintain momentum at higher levels. This also forms the base of a potential corrective move that we might see over the coming days.
Pattern analysis of the weekly chart points towards the emergence of a potential resistance area. This comes in the form of the lower trend line of the 30-month long upward rising channel, which the NIFTY breached on the downside in the first week of October 2018.
All in all, we suggest ignoring all up moves, if we get any, in the coming week. It is strongly suggested that all future up moves should be utilized to lighten the exposures. While maintaining exposure at modest levels, all profits should be vigilantly guarded at higher levels. A very cautious outlook is advised for the coming week, as we will see volatility creeping into the markets again. The NIFTY has ended outside the upper Bollinger band. But, keeping in mind the other pieces of evidence present on the chart, there are higher chances of the NIFTY getting pulled back inside the band.
Sector Analysis for the Coming Week
In our look at Relative Rotation Graphs, we compared various sectors against CNX500, which represents over 95% of the free float market cap of all the stocks listed.
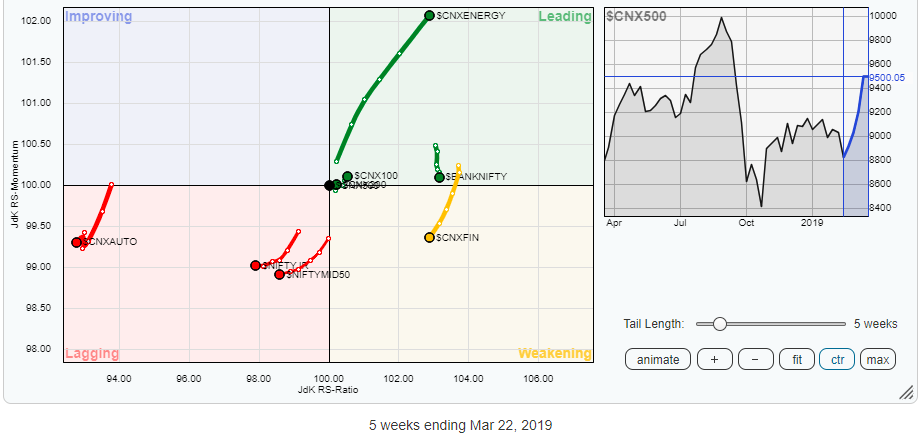
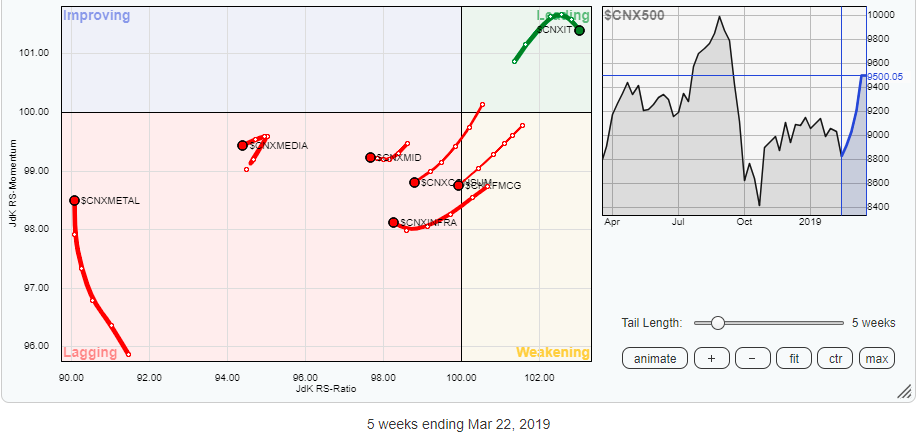
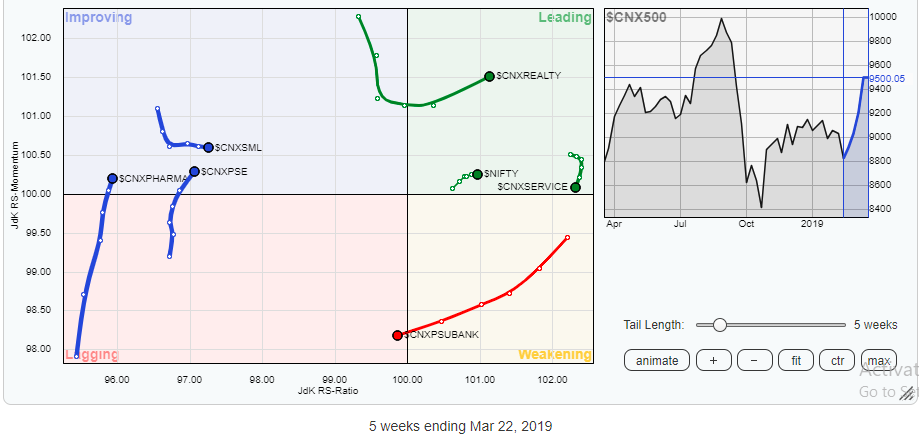
While reviewing Relative Rotation Graphs (RRG), it can be seen that the Realty Index has moved further ahead in the leading quadrant and, along with the Energy Index, it remains firmly placed to continue out-performing the general markets. Additionally, the IT Index remains in the leading quadrant, but is seen taking a breather and consolidating at current levels. This group, too, is expected to relatively out-perform the broader markets.
BankNIFTY, along with the CNX Services Sector Index, is starting to drift while stalling its momentum. The PSUBank, FMCG, Consumption, CNX Financial Services, NIFTY MID 50 and NIFTY Next 50 index are seen losing their relative momentum and drifting lower. The Auto and Media index, too, are seen faltering after some sporadic moves the previous week.
The Pharma and CNX PSE index have moved into the improving quadrant. They are expected to further consolidate their respective positions and improve their relative performance against the broader markets. The Metals Index, as well, is seen improving its relative momentum, though it currently remains in the lagging quadrant.
Important Note: RRG™ charts show you the relative strength and momentum for a group of stocks. In the above Chart, they show relative performance as against NIFTY500 Index (Broader Markets) and should not be used directly as buy or sell signals.
Milan Vaishnav, CMT, MSTA
Consulting Technical Analyst
www.EquityResearch.asia