In the previous weekly note, we had pointed out that the signs of exhaustion in the markets are visible; this week may see some profit-taking from higher levels. The past couple of days worked out much on the anticipated lines, but the profit-taking remained more intense than expected. The NIFTY gave up over 50% of the gains that it had accumulated following the announcement of the fiscal stimulus by the government. The last trading day of the week saw an extension of the selloff; the NIFTY ended with a net loss of 337.65 points (-2.93%) on a weekly basis.
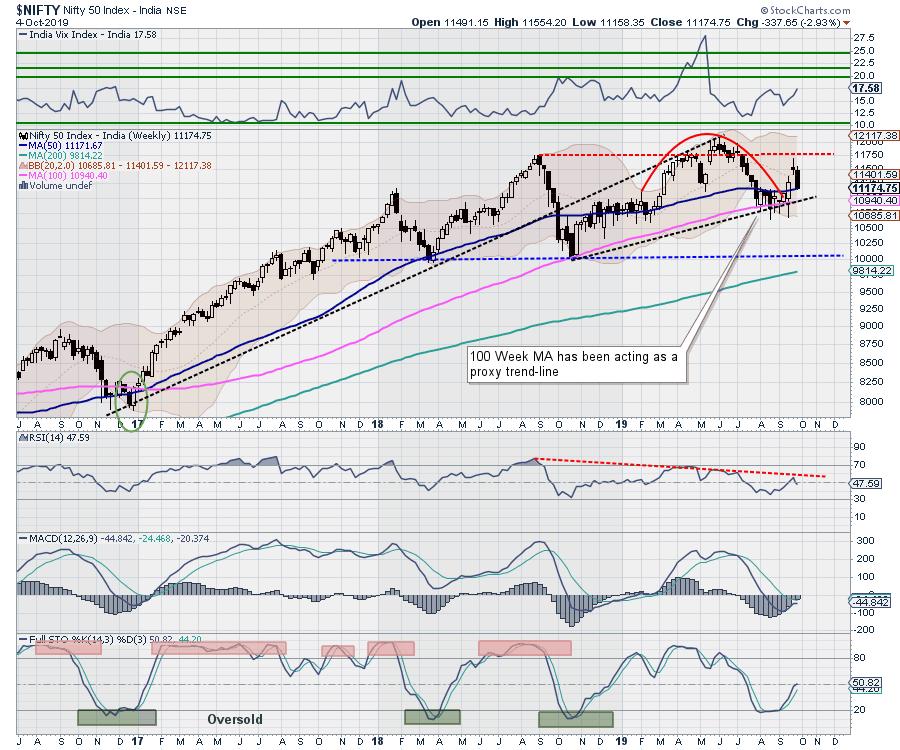
The NIFTY has taken support at the 50-Week MA, which presently stands at 11171. Two things are evident, given the current structure of the charts. First, the technical set-up remains thoroughly weak; second, some technical rebound is likely before any more downsides, given the shorts that exist in the system. Just like the previous week, this week is a truncated one, with Tuesday being a trading holiday on account of Dusherra.
The start to the week may remain volatile, and the markets may attempt to achieve stability and try a technical rebound. The coming week will see the levels of 11250 and 11380 acting as resistance points. Supports come in lower at 10940 and 10865. The trading range for the week may remain wider than usual.
The Relative Strength Index (RSI) on the weekly chart stands at 47.5903; it remains neutral and does not show any divergence against the price. The weekly MACD is bearish and trades below its signal line. A big black candle has emerged. It has lent credibility to the zone of 11550-11600 as a strong resistance zone for the markets and has shifted the resistance points lower.
The pattern analysis of the weekly charts shows an occurrence of a significant technical event on the weekly chart. After the high of 12103, the NIFTY has formed a lower top at 11694. This level is likely to act as a very strong resistance point, at least for the medium-term.
The coming week will see the market attempting to stabilize itself and try a technical rebound, despite a bearish setup. The NIFTY is oversold on some indicators on short-term charts, which may trigger some technical pullback in the markets. However, with each pullback, the markets will continue to become more vulnerable to selloff at higher levels. We recommend utilizing all technical rebounds to protect profits at higher levels and avoid aggressive long buildup of positions, as well as avoiding aggressive shorts until a rebound occurs. A highly cautious approach towards the market is advised for the week.
Sector Analysis for the Coming Week
In our look at Relative Rotation Graphs, we compared various sectors against CNX500 (NIFTY 500 Index), which represents over 95% of the free float market cap of all the stocks listed.
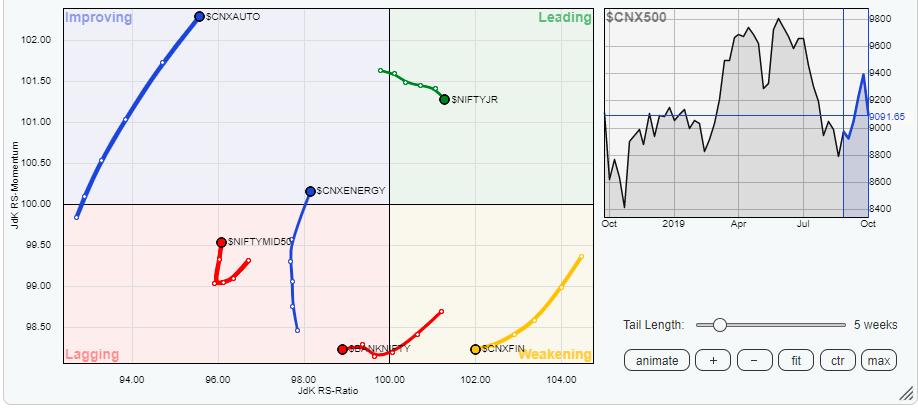

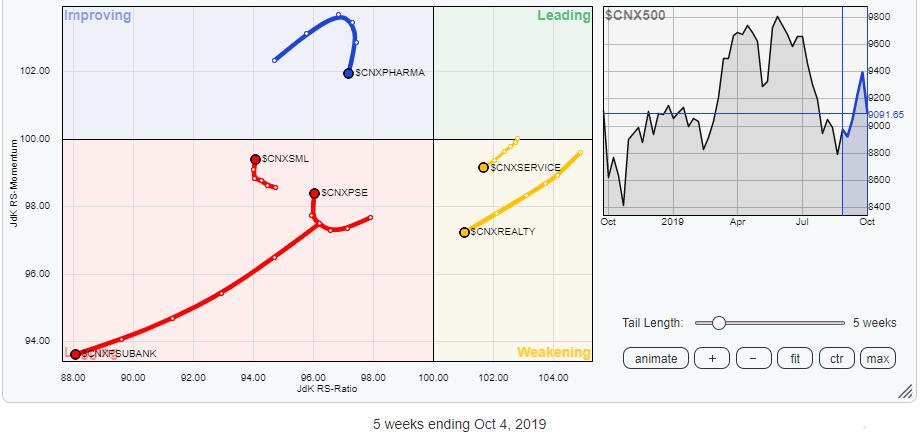
The review of Relative Rotation Graphs (RRG) shows that the FMCG and the Consumption indexes are the only two indexes that are placed comfortably in the leading quadrant of the RRG. Along with these, there is the Auto Index, which is seen steadily building upon its momentum while remaining in the improving quadrant. These groups are likely to relatively outperform the broader markets over the coming days. The IT Index also remains in the leading quadrant, but it is seen gradually giving up on its momentum and taking a breather.
There is a substantial improvement in the relative momentum of the Energy Index, and this group has crawled into the improving quadrant.
Apart from these, the Infrastructure, Metal, Financial Services, BankNIFTY and PSU banks are seen heading southward and giving up on their momentum while remaining placed differently on the RRG. The Media group has taken a U-turn for the worse. These groups are likely to relatively underperform the broader markets.
Important Note: RRG™ charts show you the relative strength and momentum for a group of stocks. In the above chart, they show relative performance against NIFTY500 Index (Broader Markets) and should not be used directly as buy or sell signals.
Milan Vaishnav, CMT, MSTA
Consulting Technical Analyst