During a truncated week that began with a short Mahurut session, the markets ushered us into the new year on a buoyant note. In the previous weekly note, it was mentioned that the NIFTY's behavior against the price zone of 11700-11750 would be crucial to watch and that a new move would depend upon the index moving past these levels. NIFTY managed to push past this zone, which saw the markets inching higher. The benchmark index NIFTY ended the week on a strong note, gaining 306.70 points (+2.65%).
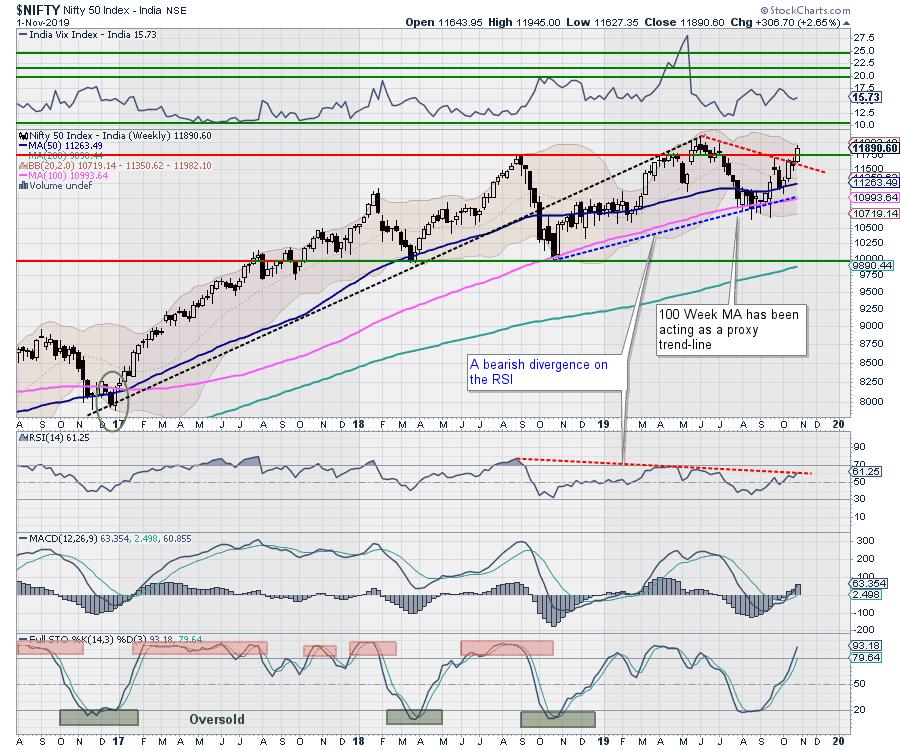
The coming week will be extremely crucial, as the market's behavior over the next days will affect its trend for the immediate short-term. Though the NIFTY has attempted a breakout on the short-term charts, it still closed just below the multi-month resistance zone of 12000-12100 on the weekly chart. While the market inched higher, it is also experiencing a bearish divergence from one of its leading indicators, the RSI. If the NIFTY inches higher and there is no confirmation, the up move may get unhealthy. On the other hand, any movement on the higher side, along with the confirmation, will lend new strength to the market.
While we may watch the market behavior with crossed fingers, there is still the possibility that the NIFTY may temporarily stall its up move and consolidate at current levels. The levels of 12000 and 12095 will act as resistance, and the supports come in at 11790 and 11710.
The Relative Strength Index (RSI) on the weekly charts is 61.5748; it can be seen making lower tops while the NIFTY attempts to inch higher. The weekly MACD remains bullish and is trading above its signal line. A white body emerged; apart from this, no significant formation was seen on the candles.
The pattern analysis of the weekly charts shows that, after peaking out once in late 2018, the NIFTY, while making incremental highs, has been unable to make a confirmed breakout. NIFTY has witnessed continued bearish divergence on the RSI as, while the index made intermittent attempts to move higher, the RSI has kept making lower highs. During the time the NIFTY made higher bottoms, the 100-week MA has almost acted as a proxy trend line for the markets.
There are a couple of things that we need to take into account. Although the NIFTY has attempted a breakout on the short-term charts by moving past the 11700-11750 zones, it has become mildly overbought on a few lead indicators. On the other hand, on the weekly charts, there is no such breakout as of now. The index has ended below its multi-month resistance points and also faces a continued bearish divergence from the RSI.
This is the time when we need to approach the markets with extreme caution. For a sustained upside, it would be prudent to wait for a breakout to happen on the weekly charts, followed by a confirmation. Unless this happens, it is recommended to chase all up moves while remaining highly vigilant at higher levels. With no breakout on the longer-term charts, the NIFTY continues to stay prone to consolidation at higher levels.
Sector Analysis for the Coming Week
In our look at Relative Rotation Graphs, we compared various sectors against CNX500 (NIFTY 500 Index), which represents over 95% of the free float market cap of all the stocks listed.
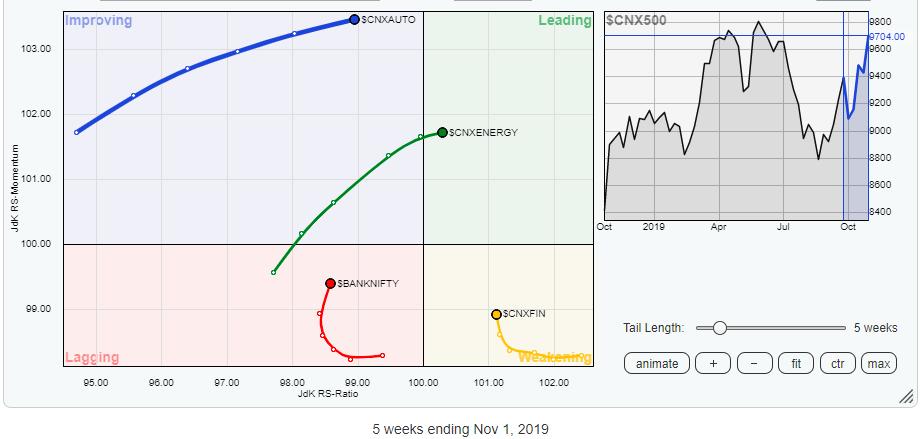
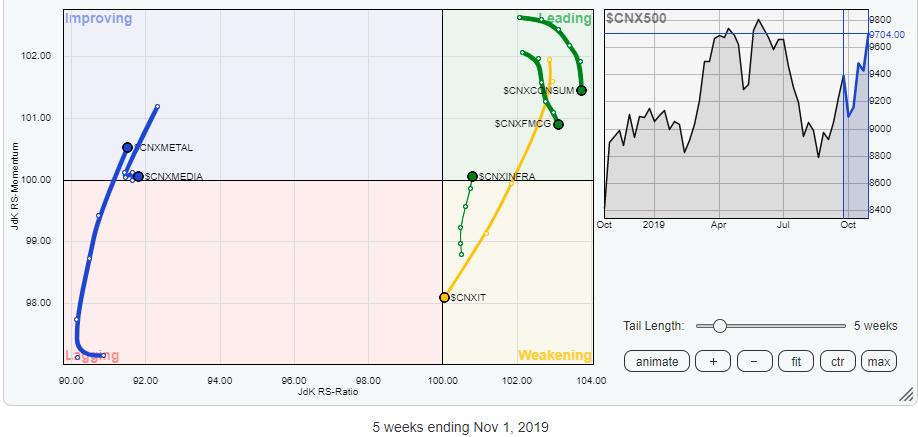
This review of Relative Rotation Graphs (RRG) shows that sector rotation has continued over the previous week as well. The Infrastructure index has crawled into the leading quadrant along with the Energy pack; these groups are likely to post resilient performances over the coming week. Apart from these groups, the FMCG and the Consumption also remain in the leading quadrant, but are seen slowing down on their momentum. Collectively, however these groups are expected to post relative out-performance against the broader markets.
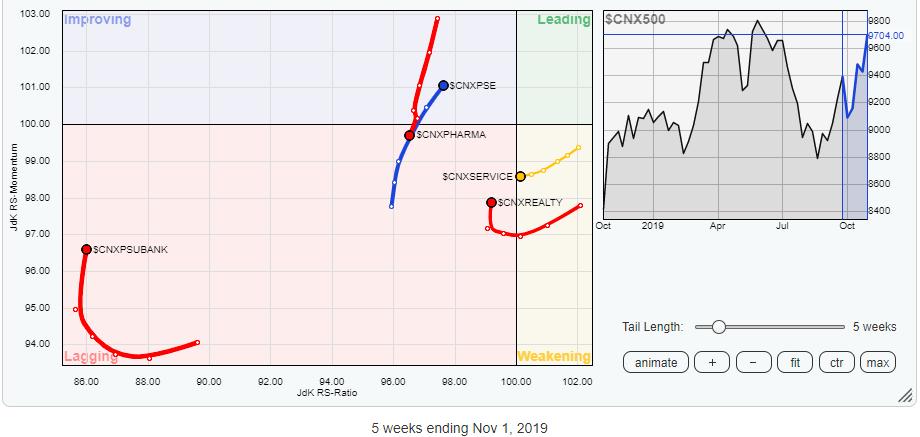
The Financial Services, BankNIFTY, PSU Banks and the Realty packs are in the Weakening and Lagging quadrants. Though they appear to have arrested their downside, they don't seem to have completely bottomed out. Some relative underperformance from these groups should not come as a surprise.
Metals, Auto and CPSE are in the Improving quadrant; these groups are likely to post isolated stock-specific outperformance against the broader markets. The Pharma and Media groups appear to be sharply losing their relative momentum and may continue to relatively underperform over the coming days.
Important Note: RRG™ charts show you the relative strength and momentum for a group of stocks. In the above chart, they show relative performance against NIFTY500 Index (Broader Markets) and should not be used directly as buy or sell signals.
Milan Vaishnav, CMT, MSTA
Consulting Technical Analyst,