With just two trading days left in the year, this week will usher us into 2020. The markets are set to end near their highs this year, but they are also leaving us at a critical juncture if we look at the market technical from the long-term point of view. We wish everyone the best for the coming year 2020.
The Indian market spent the week consolidating near its high point. Though the major part of the week was focused on the corrective note, the strong technical rebound that occurred on the last trading day of the week saw the NIFTY recouping all its losses. Given the holiday season, the volumes continued to remain on the lower side. The headline index NIFTY50 ended with a minor loss of 26 points (-0.21%) on a weekly note.
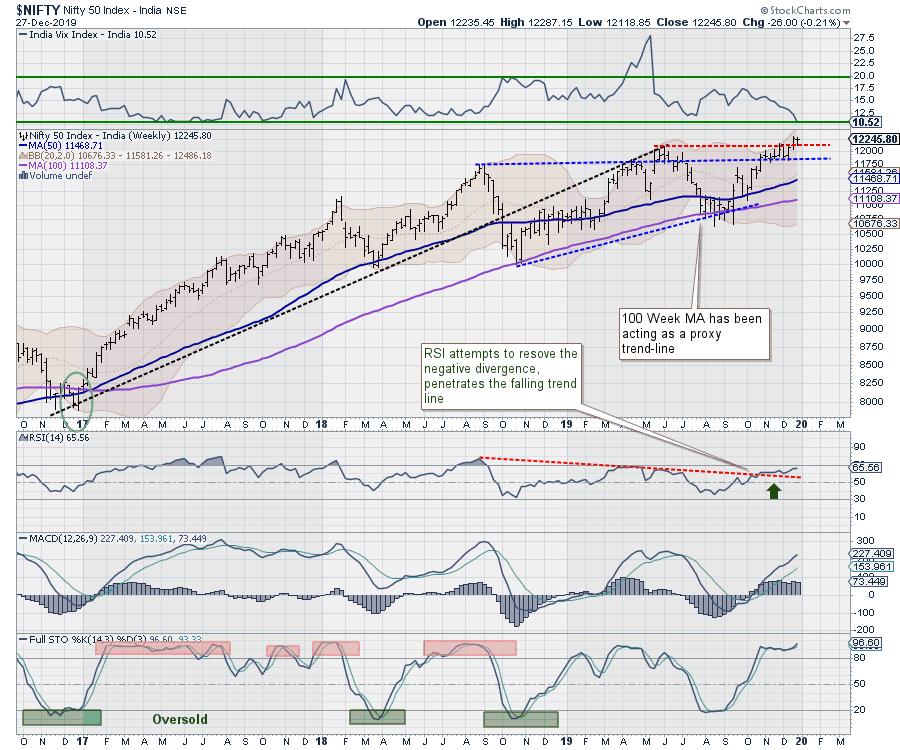
After breaking above the 12103, the NIFTY suffered a full throwback, which took the index near that level of 12103 again during the week. However, it saw a strong technical rebound on the last trading day. The critical thing to note is that the NIFTY has not moved past its previous week's high, which also remains its lifetime high point of 12293. Further, the Indian Volatility Index (INDIAVIX) has further plunged by 14.60% to 10.52, which remains the multi-year low level for the IndiaVIX. Such low levels of volatility reflect complacency of market participants and cannot be taken lightly.
Since the NIFTY has ended near the high point, we may see some modestly positive moves in the initial trade on Monday. However, speaking for the week, the levels of 12300 remain a significant point of resistance, followed by 12375. The supports will come in much lower at 12100 and 11965.
The Relative Strength Index (RSI) on the weekly chart is 65.56; it remains neutral and does not show any divergence against the price. The weekly MACD is bullish and trading below its signal line. A Spinning Top emerged on the candles, resulting out of a small real body with very little difference between the open and close prices. The formation of such a candle reflects a lack of consensus and may potentially disrupt the momentum at higher levels.
The pattern analysis of the weekly charts shows that the NIFTY has attempted a breakout; this attempt will await confirmation over the coming weeks. So long as the NIFTY keeps its head above the 12100 levels, this breakout will remain in force.
The analysis for the coming week remains on similar lines to the last week. In the event of any continued up move, we may continue to follow the trend and chase the momentum. That being said, while chasing the uptrend, it should be kept in mind that both the weekly and the longer-term monthly charts continue towards likely disruption of trend and loss of momentum at higher levels. We recommend following the trend with utmost caution and also reiterate the need for vigilant protection of profits at higher levels.
Sector Analysis for the Coming Week
In our look at Relative Rotation Graphs®, we compared various sectors against CNX500 (NIFTY 500 Index), which represents over 95% of the free float market cap of all the stocks listed.
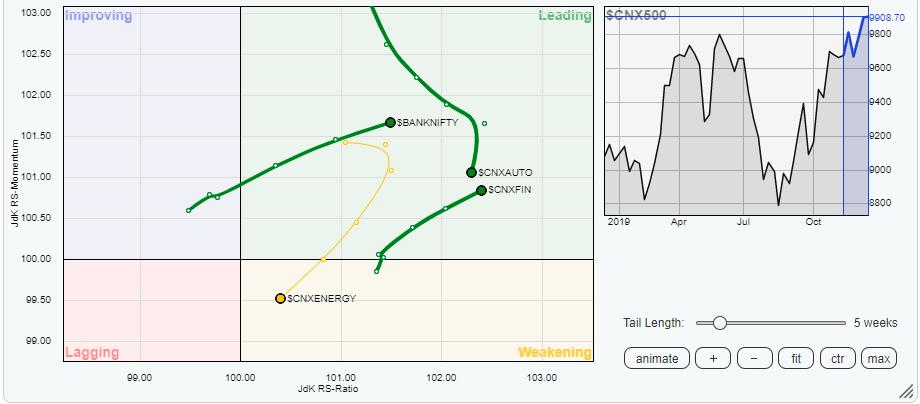
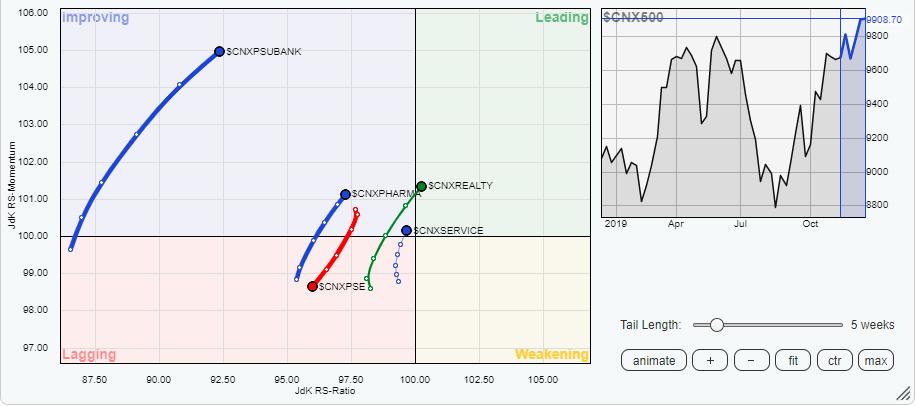
Our review of Relative Rotation Graphs (RRG) shows that steady rotation has continued in the financial space over the previous week. The BankNIFTY and the Financial Services pack have continued their advance while maintaining their relative momentum and staying in the leading quadrant. On the other hand, the PSU Banks, which are presently placed in the improving quadrant, are also seen building on their momentum and maintaining their relative outperformance.
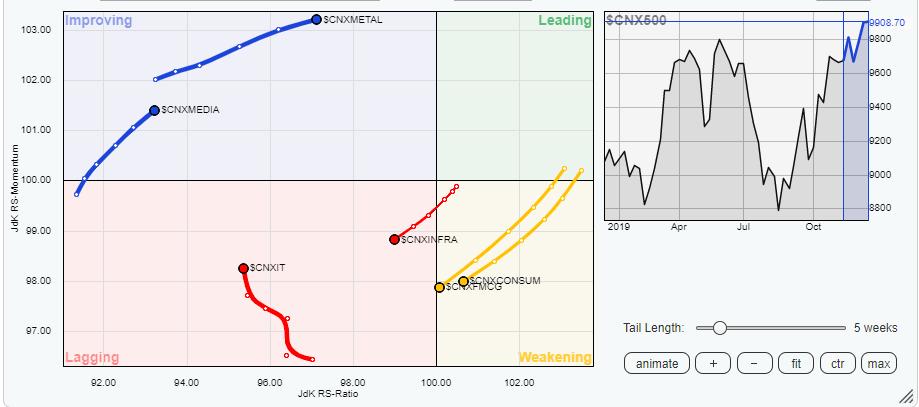
Along with the financial space, we also have the Metals, Pharma and Media groups, which are steadily heading north while maintaining their momentum. All these groups are likely to relatively outperform the broader markets over the coming week. The Realty Index has also advanced in the leading quadrant.
The IT pack is attempting to consolidate its under-performance and is seen trying to stabilize. However, it still remains in the lagging quadrant and has not completed its bottoming-out process. The Energy, CPSE, Commodities, FMCG and Consumption packs are seen steadily giving up on their relative momentum and may collectively underperform the broader markets.
Important Note: RRG™ charts show the relative strength and momentum for a group of stocks. In the above chart, they show relative performance against NIFTY500 Index (Broader Markets) and should not be used directly as buy or sell signals.
Milan Vaishnav, CMT, MSTA
Consulting Technical Analyst,