The Indian markets witnessed consolidation again for the second week in a row. The markets saw a generally stable week, one that remained in a limited and defined range and ended mildly in the negative. In the previous weekly note, we had expected the consolidation to continue, and indeed the markets traded much on the anticipated lines. The start of the new year has been subdued and had predominately low volume due to the holiday season. On the weekly note, the headline index NIFTY ended with a nominal loss of 19.15 points (-0.16%).
The coming week will see reactions to the geopolitical conflict in the Middle East, which has seen a safe asset class like Gold trading near its recent highs and the crude flaring up to higher levels. From a technical point of view, the Indian equity markets will continue to face stiff overhead resistance near the 12300 levels. The F&O data point towards the markets keeping their upsides limited. On the expected lines, volatility resurfaced and the INDIA VIX rose by 20.62% to 12.69.
The market is likely to see a volatile start to the week. The 12300 and 12390 levels will act as stiff overhead resistance points in the event of any incremental up moves. However, the supports are expected to come in much lower at 12130 and 11960. The markets showing signs of continued consolidation, but any move on the downside will not only increase the volatility, but will also make the trading range wider than usual.
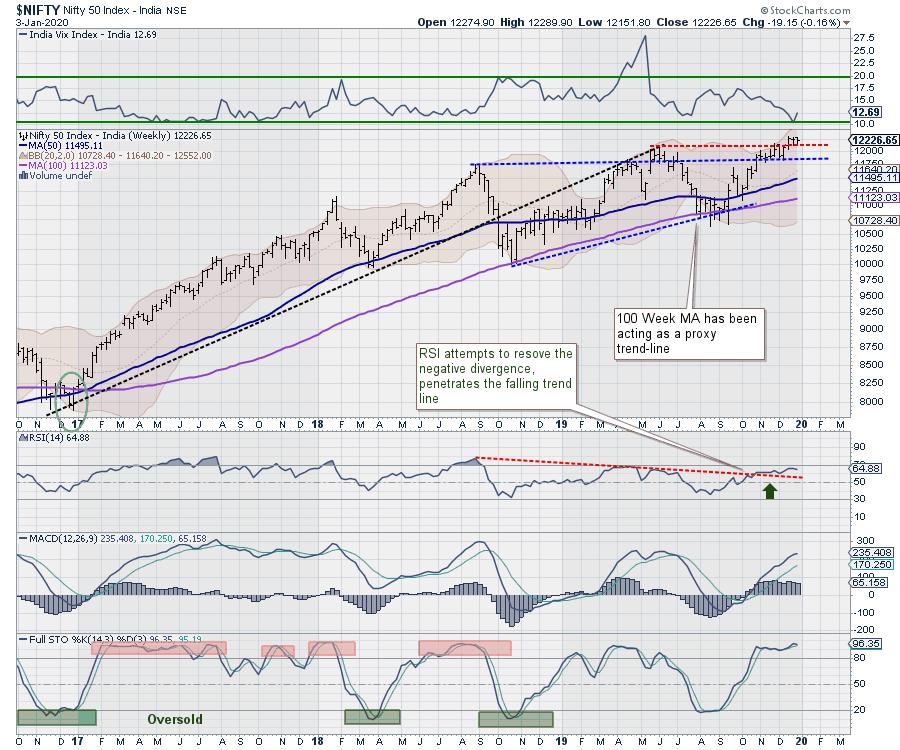
The Relative Strength Index (RSI) on the daily chart is 64.88; it remains neutral and does not show any divergence against the price. The weekly MACD is bullish and it trading above its signal line. A black body emerged on the candles; no other formations were noticed on the charts.
The pattern analysis of the weekly charts shows that the NIFTY presently remains in the secondary trade, which has been mostly in a broad range. The index attempted a breakout by resolving the bearish divergence on the RSI, but has also shown a loss of momentum at higher levels. Regardless, the attempted breakout shall remain in force so long as the NIFTY keeps its head above the 12100 levels on a closing basis.
Since the past week has seen consolidation, that keeps the analysis for the coming week also on similar lines as the prior week. The price action of the NIFTY against the zone of 12300-12350 will be crucial and, unless these levels are taken out, there is little possibility of any meaningful up-move over the coming days. We continue to recommend avoiding any excessive purchases; positions with large leverage should be avoided. We recommend continuing to protect profits at higher levels and advise a cautious view for the coming week.
Sector Analysis for the coming week
In our look at Relative Rotation Graphs®, we compared various sectors against CNX500 (NIFTY 500 Index), which represents over 95% of the free float market cap of all the stocks listed.
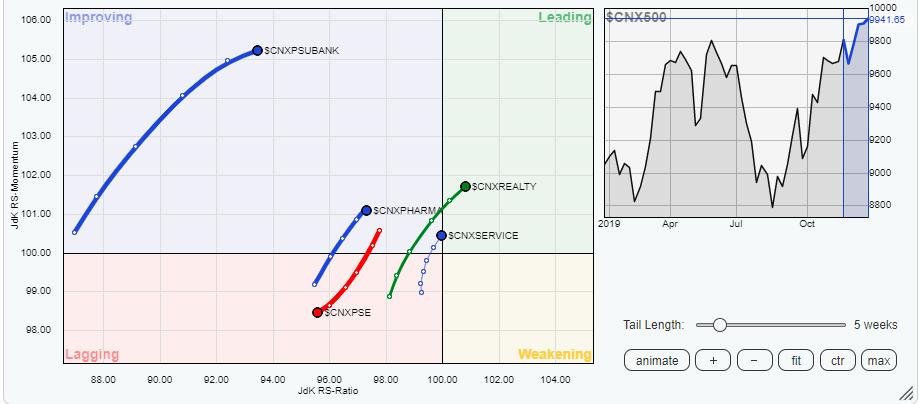
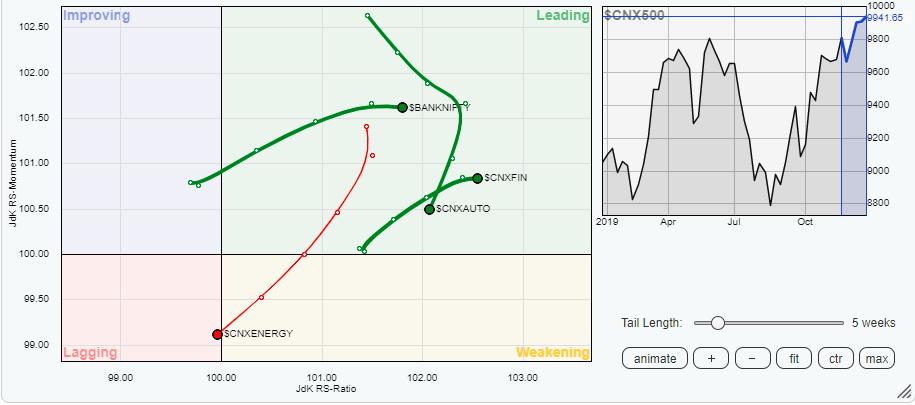
The review of Relative Rotation Graphs (RRG) shows that there is no significant change in the placement of the sectors as compared to the previous week. The Services sector is on the verge of breaking into the leading quadrant. The realty group also has advanced in the leading quadrant. The BankNIFTY and Financial services index, which are also placed in the leading quadrant along with the Realty index, are likely to outperform the broader markets on a relative basis collectively.
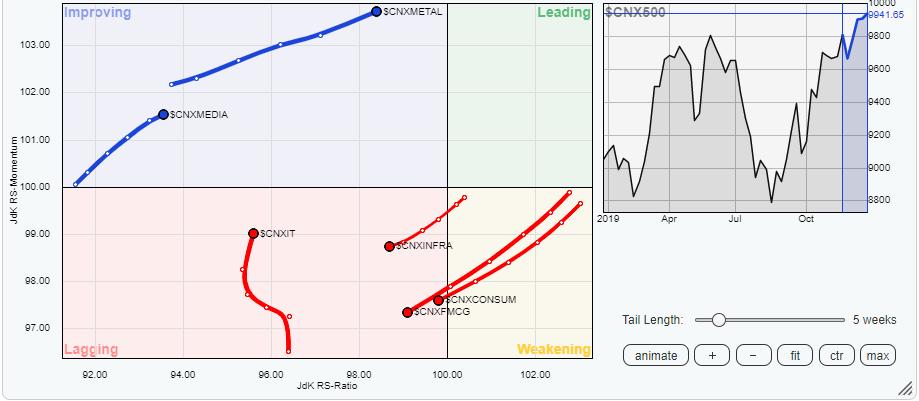
The Media and Metal indexes are also seen building on their relative momentum while staying in the improving quadrant. Some stock-specific shows can be expected from these groups.
The other vital indexes like the FMCG Index, Consumption, Infrastructure, Energy and CPSE are seen drifting lower and are presently placed in the lagging quadrant. They are all likely to continue to underperform the broader markets when benchmarked against the broader NIFTY 500 index.
Important Note: RRG™ charts show the relative strength and momentum for a group of stocks. In the above Chart, they show relative performance against NIFTY500 Index (Broader Markets) and should not be used directly as buy or sell signals.
Milan Vaishnav, CMT, MSTA
Consulting Technical Analyst,