The previous week remained a six-day trading week for the markets. Saturday, February 01, 2020, was a full-trading day because of the Union Budget that was presented. The day turned out to be a wide-ranging day for the markets on expected lines as Union Budget is one of the most important domestic events to which the markets react. After trading in a wide 546-point trading range during the week, the headline index NIFTY ended with a net gain of 136.25 points (+1.14%) on a weekly basis.
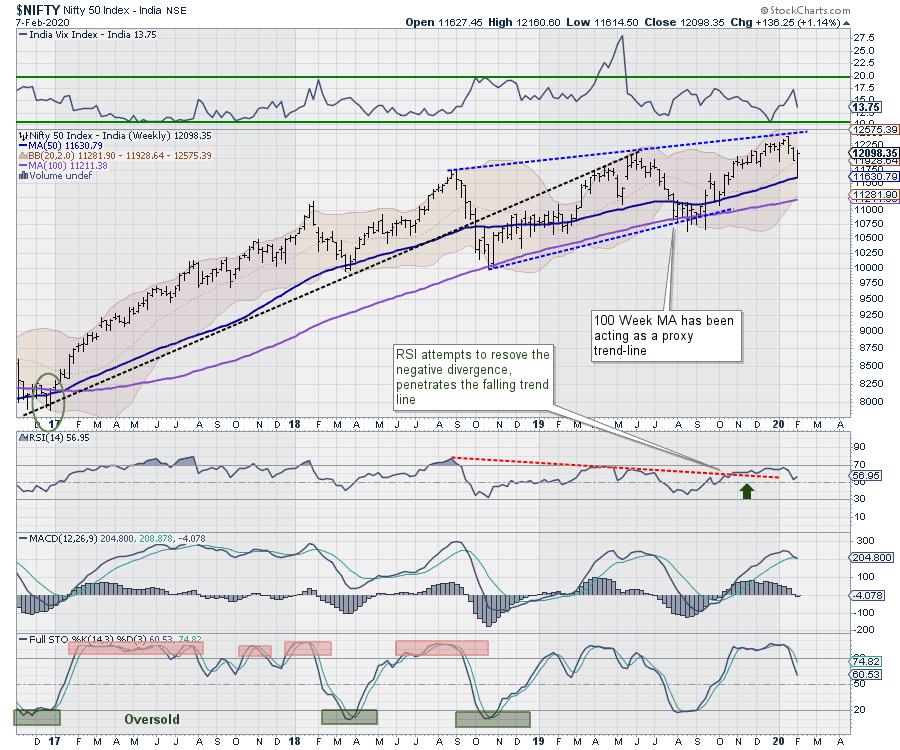
The NIFTY has pulled back from the 50-Week MA, which presently rests at 11617. The India Volatility Index – INDIAVIX, too, declined by 20.84% on a weekly basis to 13.75. Though the markets stay within a broad trading range, the 50-Week MA may act as crucial support over the immediate short-term. However, the momentum is seen decelerating as reflected by the weekly MACD indicator, which has shown a negative crossover.
The coming week is likely to see a quiet start to the day. Given the parabolic pullback that happened over the second half of the previous week, markets are unlikely to show any significant runaway up move further. The levels of 12175 and 12250 will act as overhead resistance points, while supports will come in at 12000 and 11810.
The weekly Relative Strength Index (RSI) stands at 56.95; it stays neutral and does not show any divergence against the price. The weekly MACD has shown a negative crossover; it is now bearish and trades below its signal line.
A bullish hammer occurred on the Candles. The formation may not be significant given its place of occurrence, but since it has happened at the 50-Week MA, it highlights the importance of this support area on the weekly charts.
The pattern analysis shows that the NIFTY is now back inside the broad trading range, and it also trades above its key moving averages. Having said this, the loss of momentum against turns evident, and this implies exercising caution at the current levels.
After four days of relentless short-covering from the lower levels, the NIFTY has already shown a few signs of exhaustion at the current levels. There are higher chances that the consolidation that has likely begun may spill over to the coming week as well. We strongly suggest not making aggressive purchases going ahead, but instead, use any up move that the markets may offer, to protect the profits. While keeping exposures at modest levels, a cautious view is advised for the coming week.
Sector Analysis for the coming week
In our look at Relative Rotation Graphs®, we compared various sectors against CNX500 (NIFTY 500 Index), which represents over 95% of the free float market cap of all the stocks listed.


The review of Relative Rotation Graphs (RRG) shows that from the sectoral point of view, except for the Realty index, no other index is comfortably placed in the leading quadrant. The Metal Index is seen relatively outperforming the markets with decelerating momentum, while the Financial Services and the Service sector indexes appear to be about to crawl into the weakening quadrant. From the broader indexes, the Small-Cap and the Midcap appear to be advancing firmly in the leading quadrant and are likely to outperform the broader NIFTY500 index relatively.
NIFTY IT index is seen firmly advancing in the improving quadrant; it is expected to put up a resilient performance during the coming week. The NIFTY FMCG and the Consumption indexes are seen attempting to arrest their underperformance; however, it may take a while before they start putting up a strong show.
The BankNifty index has moved into the weakening quadrant, while the Auto Index has advanced further into the weakening quadrant. The Energy pack has slipped further into the lagging quadrant while showing no signs of ending its relative underperformance as yet. PSU Banks are turning bearish while reversing its rotation sharply as it is seen rapidly giving up on its relative momentum while staying in the improving quadrant.
Important Note: RRG™ charts show the relative strength and momentum for a group of stocks. In the above Chart, they show relative performance against NIFTY500 Index (Broader Markets) and should not be used directly as buy or sell signals.
Milan Vaishnav, CMT, MSTA
Consulting Technical Analyst,