After struggling near the 12000-12025 zones for two weeks, the Indian equities finally gave out following global weakness, ending the week on a negative note. In comparison to the week prior, the NIFTY had a wider trading range to deal with. In the previous weekly note, it was mentioned that, in the event of any downside, the trading range would get wider. Over the past five sessions, the headline index oscillated in a close-to-400-point trading range. By the end of Friday's session, the benchmark index ended with a net loss of 287.95 points (-2.41%) on a weekly basis.
The NIFTY has given back more than it had gained in the previous week. On the top of that, by resisting near the 12000-12025 zone for two weeks and coming off from that level, it has reinforced this zone as a crucial resistance point for the markets over the coming weeks. Unless the NIFTY moves past this level convincingly, any sustainable up move is unlikely - and the markets will stay vulnerable to profit-taking bouts at higher levels. On the expected lines, the volatility also increased. The INDIAVIX surged 13.40% to 24.75 on a weekly note.
The start of the week is once again likely to be on a shaky note. The levels of 11750 and 11835 will act as resistance points. The supports will come in at the 11550 and 11400 levels.
The weekly RSI is 57.55; it remains neutral and does not show any divergence against the price. The weekly MACD is still bullish and it trades above the signal line.
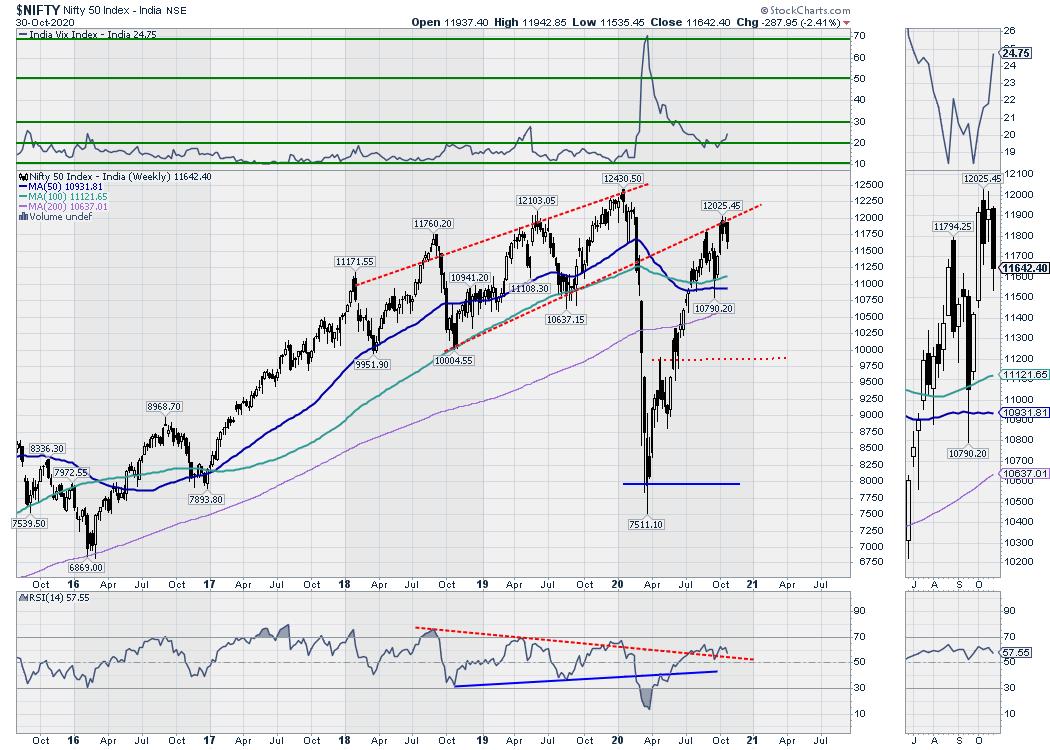
A bearish engulfing pattern occurred on the candles. The occurrence of a large bearish engulfing pattern just below the 12000-12025 resistance zone makes this zone a stiff resistance for the markets and highlights the credibility of this resistance zone.
As evident from the charts, the up move in the markets halted exactly as it tested the trend line pattern resistance. This is the lower trend line of the broad channel that the NIFTY violated in February as it breached it on the downside. The current market behavior has also highlighted the validity and importance of this channel as the trend line and a pattern resistance for the NIFTY.
Just like the week before this one, we will see the markets staying highly stock-specific in nature. Some minor pullbacks may not be ruled out, as the NIFTY has tested pattern supports on the short-term charts. However, the markets will stay dominated with global technical setup, which also remains challenging for the near term. Any rebound in the US Dollar will also have to be watched, and the global asset allocation is likely to show preference or the less risky assets.
We reiterate continuing to approach the markets on a highly cautious note. While keeping leveraged exposures under control and at moderate levels, sticking to traditional will offer better relative strength and risk-reward ratio in the near-term.
Sector Analysis for the Coming Week
In our look at Relative Rotation Graphs®, we compared various sectors against CNX500 (NIFTY 500 Index), which represents over 95% of the free float market cap of all the stocks listed.

Our review of Relative Rotation Graphs (RRG) shows that, as of the week ending this Friday, the IT sector is the only one placed in the leading quadrant and not rotating unfavorably. The NIFTY Media and Midcap 100 groups are also placed in the leading quadrant, but they appear to be rotating negatively following a south-westerly rotation within the quadrant.
NIFTY Auto has advanced further in the weakening quadrant. The Pharma and the Metal Index are also in the weakening quadrant.
The NIFTY PSE, Infrastructure and Energy sectors continue to languish in the lagging quadrant. The NIFTY PSU Banks have moved further inside the lagging quadrant, highlighting the disconnect between the relative performance of PSU and the Private banks. The FMCG and Consumption sectors are also in the lagging quadrant, but they appear to be improving their relative momentum and look to be in the process of getting bottomed out.
The Financial Services, BankNifty and Services sector groups are in the improving quadrant and appear to be steadily maintaining their relative momentum. They are likely to contribute to stock-specific relative out-performance along with the FMCG and Consumption packs.
Important Note: RRG™ charts show the relative strength and momentum for a group of stocks. In the above chart, they show relative performance against the NIFTY500 Index (Broader Markets) and should not be used directly as buy or sell signals.
Milan Vaishnav, CMT, MSTA
Consulting Technical Analyst,