In a truncated week, the Indian equities failed to take any directional cues and traded all over the places over for four trading sessions, before ultimately ending the week with a modest gain. The start of the week stayed volatile, with the NIFTY trading in a wide range. However, the earlier week had seen a wider trading range of over 634 points, whereas the previous four days saw the NIFTY oscillating in a relatively narrower 416-points range. Broadly speaking, the NIFTY continued to resist to the lower top formed on the daily charts, which have a level of 15250-15300 acting as a stiff resistance. Following a sharp corrective move seen on the last trading day of the week, the headline index ended the day with a net gain of 92.85 points (+0.62%).
Despite improving market breadth on the frontline Index, the NIFTY has confirmed its slip into a broad-ranged consolidation. On the higher side, the zone of 15250-15300 continues to act as a stiff resistance zone; unless this zone is taken out, the Index will struggle to see any meaningful upside. Even with wide-ranging moves, the volatility tapered down; the INDIAVIX came off by 15.07% to 21.71 on a weekly note. Over the coming week, the rise in volatility in the US Bond Yield will be closely watched; a strong US Dollar will continue to remain a temporary cause of concern for the emerging markets as a whole. However, the NIFTY has made a higher top and a higher bottom on the Weekly Charts.
Given the sharpness of the fall on the last trading day, there is a possibility of a technical pullback as we approach the coming week. NIFTY has added fresh shorts in the system, and the NIFTY PCR across all expiries stands even at 1.02; this may well aid some technical pullback in the next week. The levels of 15180 and 15300 will act as resistance, while supports will come in at the 14900 and 14850 levels. Regardless of the direction the market trades in, the trading range is likely to remain wider over the coming days.
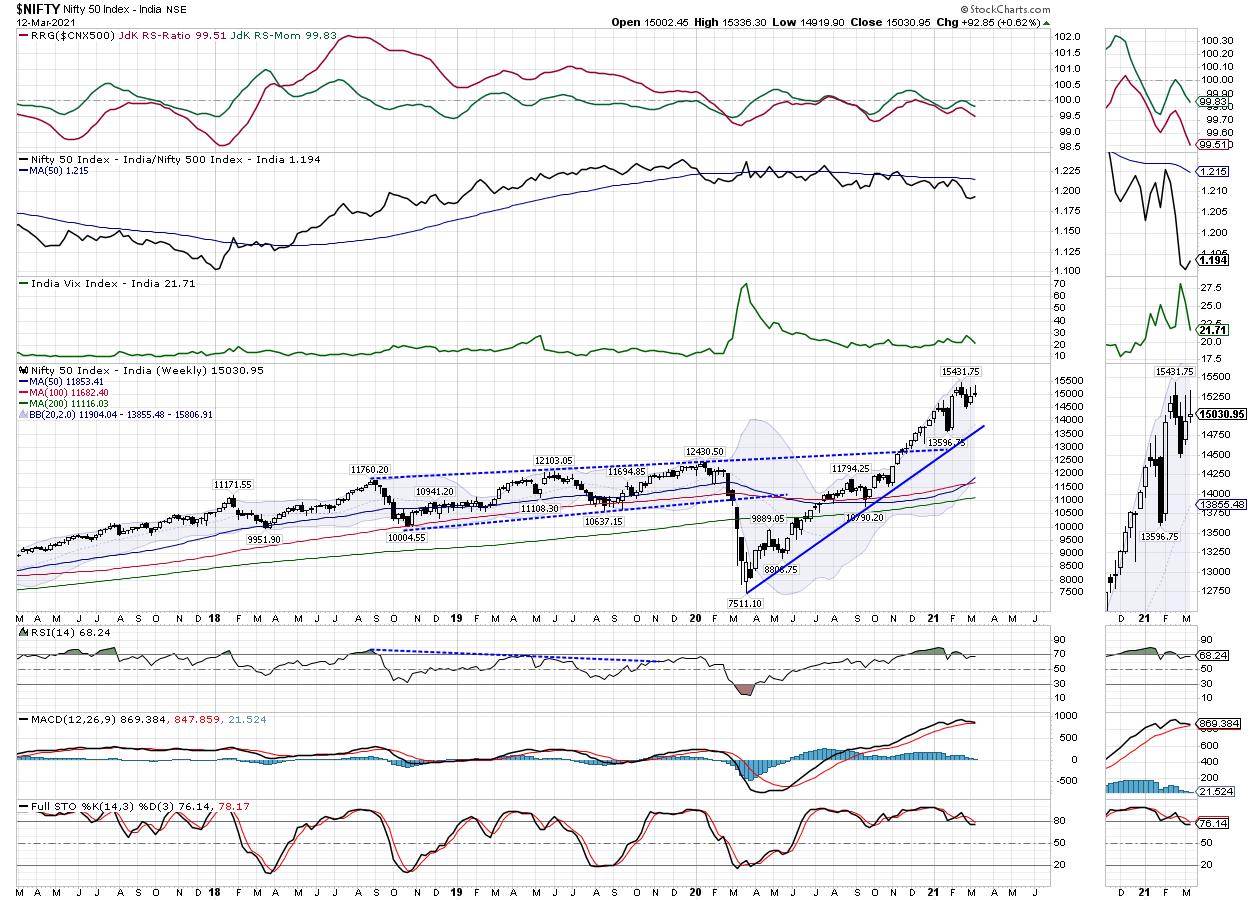
The weekly RSI stands at 68.24; it remains neutral and does not show any divergence against the price. The weekly MACD is bullish and remains above its signal line. A candle with a long upper shadow occurred. Such candles, if they emerge near the high point may have the potential to disrupt the current trend. However, there are larger possibilities of continued consolidation.
The pattern analysis of the weekly chart shows that the NIFTY has slipped in a broad range consolidation, with the immediate resistance zone at 15250-15300 levels. Though the immediate support remains near the 14850-14900 zone, the fastest 20-week MA is far away from the current levels at 13855. This shows the extent to which the NIFTY had deviated from its mean. The wider-than-normal Bollinger Bands indicate that, even if there are no major corrective moves, the Index may well stay in a broadly defined range and go through some wide-ranged consolidation over the coming days.
All in all, the broader markets have still continued to relatively outperform. The overall market breadth has been improving, which remains a good sign. There is also a good number of fresh shorts added to the system. However, regardless of the shorts that may lend support in the form of short-covering from lower levels, fresh buying in the Cash segment is an absolute necessity. It would be important to see if fresh buying takes place apart from short-covering led bounces.
The markets have become highly stock-specific in nature. As mentioned in the previous weekly note, we will see pockets of stock-specific outperformance and the defensive play will continue to remain at the forefront. We recommend not chasing any particular sector as a theme, but remain highly stock-specific and selective in the approach. With the depreciating Rupee, IT may well show improved relative strength, along with select Auto, Energy, Infrastructure and Mid Cap stocks. While staying light on leveraged exposure, a cautious approach with vigilant protection of profits at higher levels is advised for the coming week.
Sector Analysis for the Coming Week
In our look at Relative Rotation Graphs®, we compared various sectors against CNX500 (NIFTY 500 Index), which represents over 95% of the free float market cap of all the stocks listed.

A review of Relative Rotation Graphs (RRG) provides some interesting insights. The NIFTY PSE and NIFTY Infrastructure Indexes have entered the leading quadrant. The NIFTY Auto and the Commodities groups also remain in the leading quadrant, along with NIFTY MidCap 100 Index, while steadily maintaining its relative momentum. The Small Cap Index is also in the leading quadrant, but it appears to be paring its relative momentum. However, these groups will continue to relatively outperform the broader NIFTY 500 Index.
The NIFTY Realty Index has slipped inside the weakening quadrant. The NIFTY Bank, Services Sector Index, Services and IT indexes are also in the weakening quadrant. The Metal Index is seen rotating back towards the leading quadrant as it shows a sharp improvement in its relative momentum against the broader markets.
The NIFTY Media, Pharma, FMCG and Consumption Indexes continue to languish inside the lagging quadrant. They are rotating in a south-westerly direction; these groups are likely to relatively underperform the broader markets over the coming days.
The NIFTY Energy Index remains in the improving quadrant. However, it is seen steading making a north-easterly rotation and is expected to continue posting a resilient show in the coming week.
Important Note: RRG™ charts show the relative strength and momentum for a group of stocks. In the above chart, they show relative performance against NIFTY500 Index (Broader Markets) and should not be used directly as buy or sell signals.
Milan Vaishnav, CMT, MSTA
Consulting Technical Analyst,