After eight weeks of consolidation, the Indian markets gave yet another break out as it surged above the crucial 15900-15950 zone. The past four out of five saw the markets inching relentlessly higher as it not only demonstrated renewed strength but also made the present breakout sustainable. The markets saw a 514-point trading range; this entire range had a one-way upside directional bias throughout the week. Following such strong moves, the headline Index NIFTY ended with strong gains of 475.15 points (+3.01%) on a weekly basis.
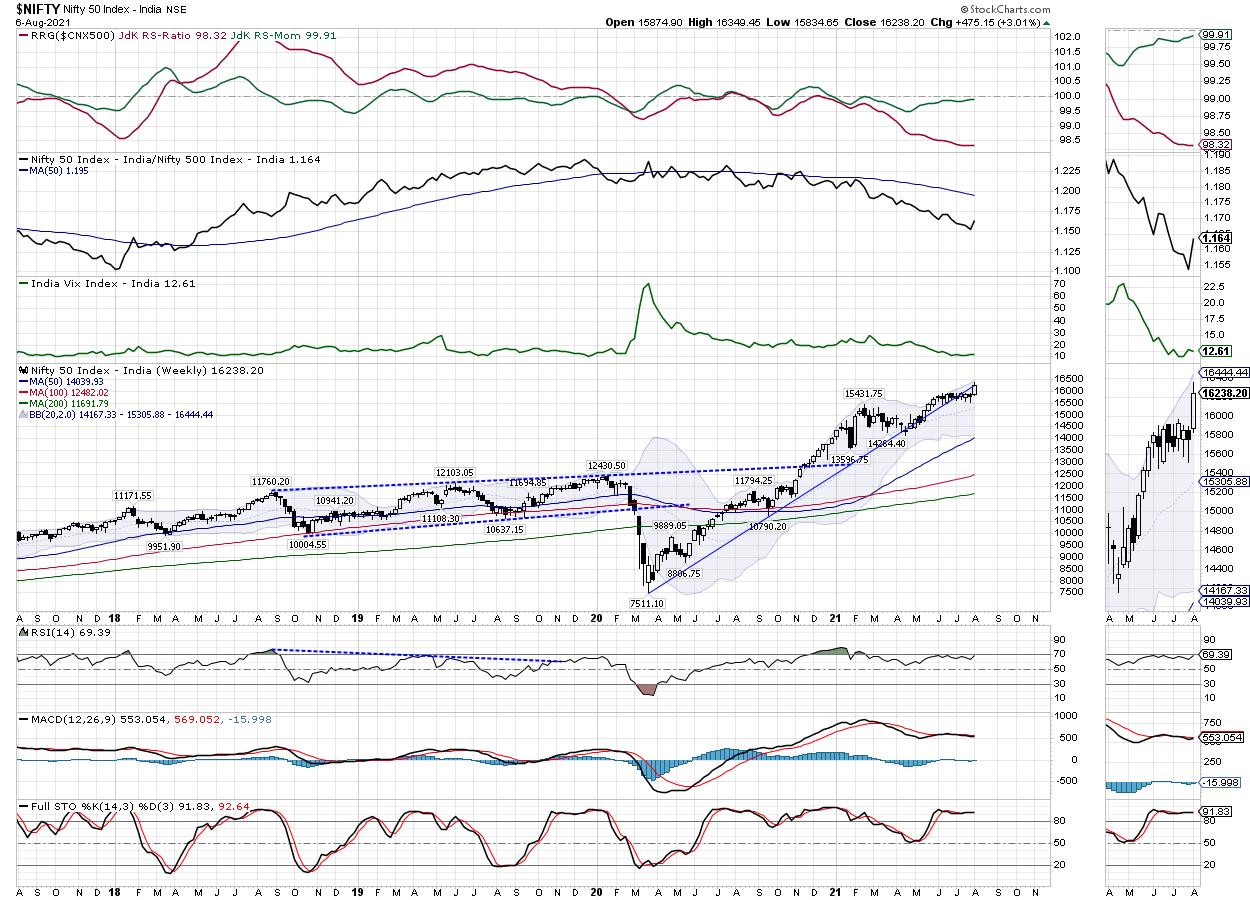
From the technical perspective, the markets have made themselves not only stronger but also it has dragged their support levels higher. There is a breakout visible on the weekly charts as well; any corrective move or broad consolidation will now see 15900-15950 levels playing out as supports. The volatility continued to decline; the INDIAVIX came off marginally by 1.52% to 12.6100. On the weekly charts, the NIFTY is now in uncharted territory once again; the options data shows that the NIFTY may consolidate with positive bias while maintaining its internal strength so long as it keeps its head above the 16000 levels.
The coming week will see the levels of 16400 and 16550 acting as immediate resistance levels. The supports come in at 16100 and 15950 levels.
The weekly RSI is 69.39; it stays neutral and does not show any divergence against the price. The weekly MACD has shown a positive crossover; it is now bullish and above the signal line. A white body emerged on the candles; this showed the directional consensus of the market participants on the upside. Apart from this, no other major formation was seen on the charts.
The pattern analysis shows that the NIFTY has staged a strong breakout after consolidating in a defined range for eight weeks. For this breakout to sustain and remain valid, NIFTY will have to keep its head above the 15900-15950 zone.
The BankNIFTY has relatively underperformed and is away from its lifetime high point. It is largely expected that this index will play catch-up over the coming week. It is expected that the broader markets will largely relatively underperform the NIFTY and is likely to get highly stock specific. We recommend focusing on the defensive large caps from the Consumption, FMCG, and IT universe. Select banking stocks are also likely to relatively outperform. While the momentum may be followed as the NIFTY continues to display strength, it should be done cautiously while protecting profits at higher levels.
Sector Analysis for the coming week
In our look at Relative Rotation Graphs®, we compared various sectors against CNX500 (NIFTY 500 Index), which represents over 95% of the free float market cap of all the stocks listed.

The NIFTY IT Index is seen rotating strongly inside the leading quadrant. This group is evidently set to outperform the broader markets on a relative basis. Small Cap Index is also inside the leading quadrant; however, it appears to be losing on its relative momentum.
NIFTY Metal stays inside the weakening quadrant along with NIFTY Pharma Index. Apart from this, while the NIFTY PSE Index stays inside the weakening quadrant, the NIFTY PSU Bank index has rolled inside the weakening quadrant.
Infrastructure Index is inside the lagging quadrant along with the Services and the Financial Services sector Index. However, these groups appear to be consolidating along with the Banknifty. Collectively they may either improve their relative performance or may show some reliance and consolidation.
The FMCG and Consumption index is seen moving strongly inside the improving quadrant. They are likely to put up a good show along with select banks and the IT group and post a relatively better show going ahead from there.
Important Note: RRG™ charts show the relative strength and momentum for a group of stocks. In the above Chart, they show relative performance against NIFTY500 Index (Broader Markets) and should not be used directly as buy or sell signals.
Milan Vaishnav, CMT, MSTA
Consulting Technical Analyst
www.EquityResearch.asia | www.ChartWizard.ae
· For Premium Equity Portfolio Advisory on Indian Stocks, Click Here
· Alpha-generating actionable investment ideas on the US and UK Equities Click Here
· For International Commodities like Gold, Crude Oil and EURUSD/GBPUSD pairs Click Here
e