Geopolitics. This was the only factor that continued to hold the global equity markets at ransom; it continued to fracture the sentiments of the markets and India was no exception. With the war between Russia and Ukraine showing no signs of slowing down, the equity markets, both global and domestic, continued to trade on a tentative note. The NIFTY witnessed gap downs during the week, oscillated in a wide 682-point range before ending the week on a negative note. Few important technical levels were violated by the markets; the headline index ended with a net loss of 413.05 points (-2.48%) on a weekly basis.
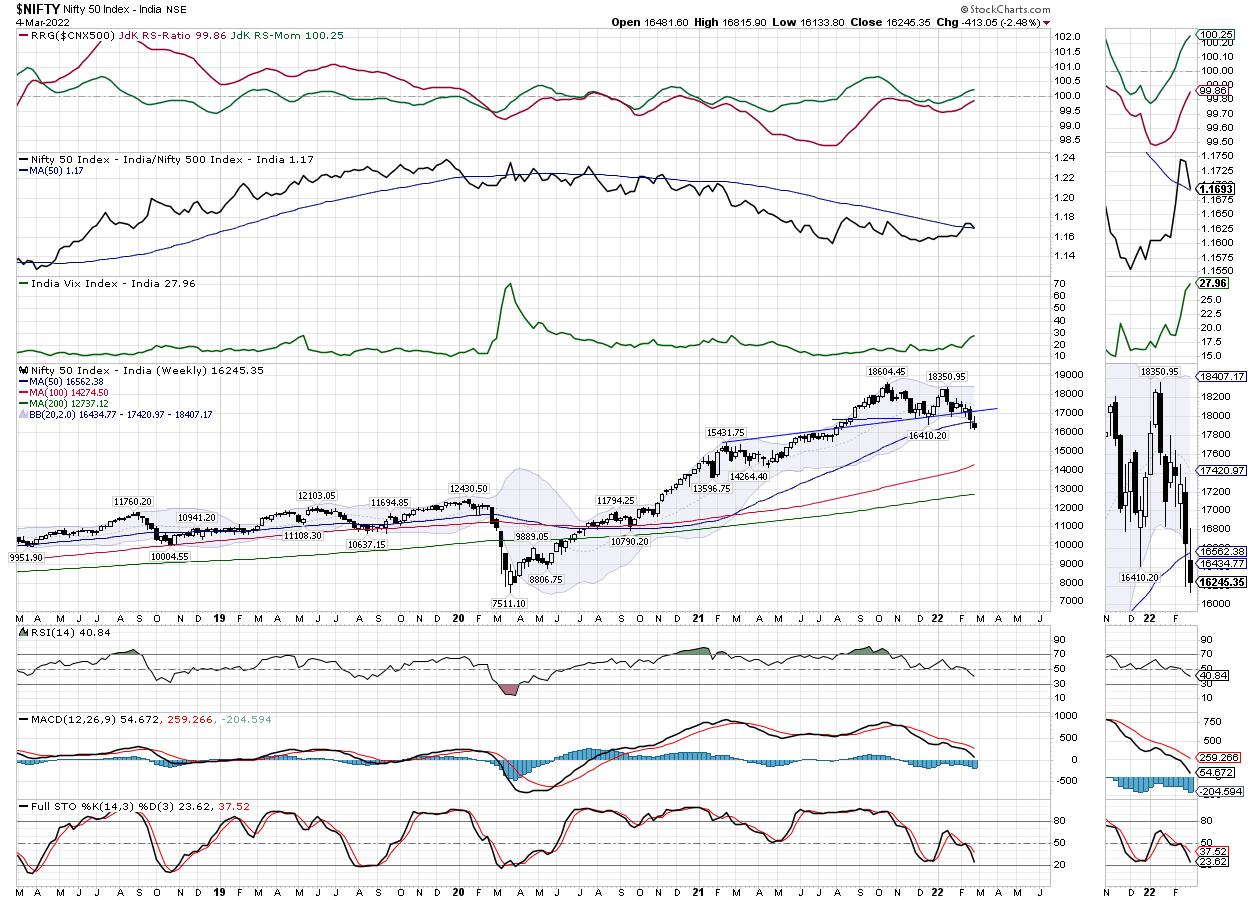
From a technical perspective, NIFTY had defended the 50-Week MA level, which presently stands at 16564. However, this week, it has violated and slipped below this point. Applying the basic tenet of technical analysis, any support that is once violated becomes a resistance. In this context, the 50-Week MA may pose minor resistance to the markets when it tries to pull back. In the same breath, over the past sessions, a large number of shorts positions have been added across the board. This may lead to a sharp short-covering-led pullback at the slightest trigger. So, it will be more important to watch the trend line support that the NIFTY has violated, which falls in the region of the 16750-1680 levels. In any case, at present, the markets remain highly uncertain and on tenterhooks.
The volatility arrested its spike. INDIAVIX rose by just 4.55% to 27.96, though it remains at its multi-month high point. The coming week is likely to see the trading range remain wider than usual. The levels of 16400 and 16550 will act as probable resistance points; the likely supports will come in at the 16150 and 15900 levels.
The weekly RSI stands at 40.81; it has marked a 14-period low, which is bearish. It continues to remain neutral and does not show any divergence against the price. The weekly MACD is bearish and below its signal line. A black body emerged on the candles; this reflected the bearish directional bias of the market participants. Apart from this, no other formations were noticed on the charts.
The pattern analysis shows that the NIFTY has violated the pattern support in form of a trend line beginning from the 15400 level and joining the subsequent high points. Apart from violating this pattern support, NIFTY has also breached and closed below the 50-Week MA, which presently stands at 16564. This makes the zone of 16600-16850 a strong resistance zone for the NIFTY over the coming days.
From a broader standpoint, the technical structure of the markets remains weak. At the same time, regardless of how fluid the geopolitical tensions can be, it is important to note that the markets have added a lot of fresh shorts in the system over the past sessions. Of course, such markets offer a lot of shorting opportunities, but the safer method to deal with such setups would be to focus on the badly beaten sectors that show more chances of a sharp technical pullback. Over the coming days, we may see some badly beaten auto, financial and pharma stocks experience a pullback. PSE and Oil and Gas space will continue to do well. It is recommended that you continue staying light on exposures. While keeping overall exposure at modest levels, vigilant protection profits on either side are advised for the coming week.
Sector Analysis for the Coming Week
In our look at Relative Rotation Graphs®, we compared various sectors against CNX500 (NIFTY 500 Index), which represents over 95% of the free float market cap of all the stocks listed.

The analysis of Relative Rotation Graphs (RRG) shows that NIFTY Commodities, Energy, Metal, PSE and the PSU Bank Index are firmly placed inside the leading quadrant. NIFTY Auto is inside the leading quadrant as well, but appears to have faltered on its relative momentum front. Apart from this, the NIFTY Bank index has rolled inside the leading quadrant; all these groups are likely to contribute to the relative outperformance against the broader markets.
NIFTY Media and the IT indices stay in the weakening quadrant.
The NIFTY Mid-Cap 100 index has rolled inside the lagging quadrant and may relatively underperform the broader markets, along with the Consumption and the Realty Index.
NIFTY Pharma, FMCG, and the Financial Services Index stay in the improving quadrant; they are likely to put up a relatively resilient show against the broader NIFTY 500 index.
Important Note: RRG™ charts show the relative strength and momentum for a group of stocks. In the above Chart, they show relative performance against NIFTY500 Index (Broader Markets) and should not be used directly as buy or sell signals.
Milan Vaishnav, CMT, MSTA
Consulting Technical Analyst
www.EquityResearch.asia | www.ChartWizard.ae