The Indian equity markets managed to recover half of what they had lost in the earlier week. Over the past five days, the markets traded largely positive and went on to test the previous support levels that they had violated on their way down. The trading remained just as wide; the NIFTY oscillated 558.15 points before closing the week with gains. The index also went on to hold some important support, which that makes the coming week quite interesting and crucial. After a predominantly positive behavior, the headline index NIFTY 50 ended with a gain of 405.75 points (+2.65%) on a weekly basis.
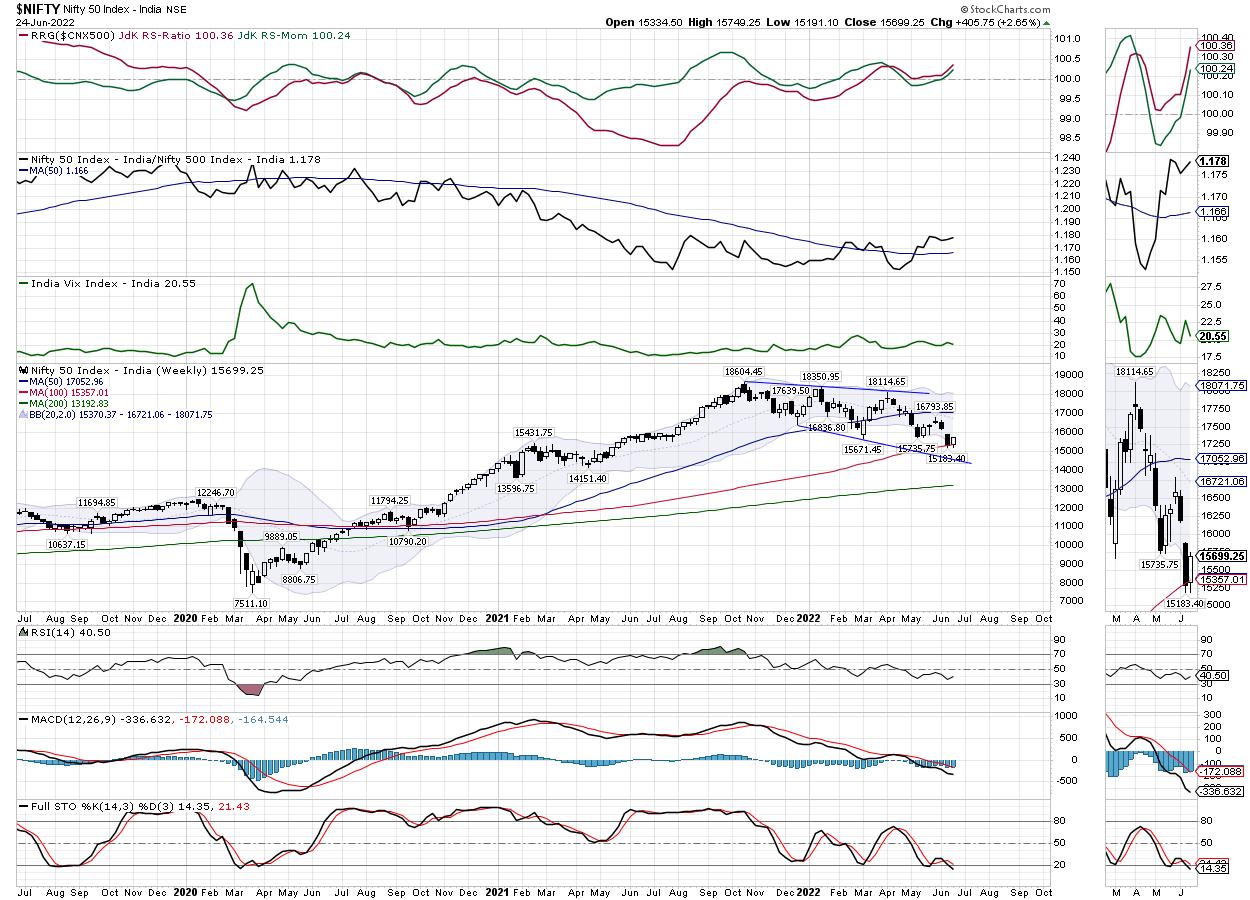
From a technical perspective, it is important to note that the NIFTY has respected and held the 100-Week MA as support on a closing basis. The 100-Week MA presently stands at 15357. Following an intra-week dip below this point, the NIFTY has managed to recover from lower levels and has closed above this crucial support. The 100-Week MA remains an important support for the markets for the immediate short term. Besides this, another technical factor worth taking note of is that the NIFTY has halted its rally precisely near 15700; this is the double bottom support that the NIFTY violated on the downside. This may, theoretically, act as a resistance for the markets. In other words, any move above 15700 is likely to lend some more strength to the markets.
The coming week is likely to see a stable start; the levels of 15830 and 16000 are expected to act as immediate resistance levels. The supports come in at 15530 and 15380 levels. The trading range will probably remain wider than usual.
The weekly RSI is 40.50; it remains neutral and does not show any divergence against the price. The weekly MACD is bearish and staying below the signal line. A white-bodied candle emerged; it shows a directional consensus of the market participants on the upside.
The pattern analysis of the weekly chart shows that, despite a violation of the important 100-Week MA, the index has held on to this support on a weekly closing basis. This 100-Week MA is presently at 15357. On the upside, the NIFTY is approaching the double bottom support that it has violated on the way down.
The derivative data show the probable trading range between the 15500-16000 levels. However, for the markets to scale higher, it would be crucial to move past and stay above the 15700 level. In other words, 15700 is likely to act as an inflection point; any move above this level will propel the markets higher. Also, in the same way, if the NIFTY is not able to move past the 15700 point, the market may stay under some ranged consolidation. Overall, it is expected that the markets may stay highly stock-specific, with both high and low beta stocks from select pockets doing well in the markets. While avoiding shorts, a cautiously positive outlook is advised for the day.
Sector Analysis for Today
In our look at Relative Rotation Graphs®, we compared various sectors against CNX500 (NIFTY 500 Index), which represents over 95% of the free float market cap of all the stocks listed.

The analysis of Relative Rotation Graphs (RRG) shows that the NIFTY Bank, Auto, FMCG, and Consumption indexes are firmly placed inside the leading quadrant. These sectors are likely to relatively outperform the broader NIFTY500 index. The NIFTY Infrastructure Index is also inside the leading quadrant; however, it is seen paring its relative momentum against the broader markets.
NIFTY Pharma, Energy, Commodities, and PSE indexes are inside the weakening quadrant. Stock-specific shows cannot be ruled out, but, overall, these sectors may show some inclination to take a breather.
NIFTY Metal has rolled inside the lagging quadrant. It is likely to relatively underperform the broader markets. Besides this, PSU Bank, Realty, and Media Indices are also seen languishing inside the lagging quadrant. NIFTY IT and Services sector index is inside the lagging quadrant, but these groups are seen trying to improve their relative momentum against the broader markets.
Important Note: RRG™ charts show the relative strength and momentum for a group of stocks. In the above Chart, they show relative performance against NIFTY500 Index (Broader Markets) and should not be used directly as buy or sell signals.
Milan Vaishnav, CMT, MSTA
Consulting Technical Analyst
www.EquityResearch.asia | www.ChartWizard.ae