After closing with gains for four weeks in a row, the markets finally took a breather on the expected lines.
In the previous weekly technical note, it was mentioned that the formation of a Shooting Star on candles has the potential to temporarily halt the present rally. Since then, the markets traded much on the anticipated lines amid a narrow trading range. Over the past five days, the NIFTY oscillated in a 304-point range while not moving past the previous week's high point. While forming a lower high and a similar low as compared to the previous week, the headline index closed with a net loss of 98.95 points (-0.50%) on a weekly basis.
The highlights of the past week from a technical perspective were a couple of things. The volatility, as measured by INDIAVIX, has now dropped to a multi-year low. While it was lower anyways, it came off yet again by another 11.75% to 10.14; this level remains an all-time multi-year new low for the VIX. Such a low level of VIX is a sign of massive complacency of market participants; by no means should this be ignored, as it leaves us vulnerable to sharp profit-taking bouts at current levels. Besides this, the high point of 19991 has now become an intermediate top for the markets; unless taken out, this has the potential to push the markets into a secondary trend while making them highly stock-specific in terms of performance.
The coming week is likely to see the levels of 19850 and 19990 acting as potential resistance points; supports will come in at the 19500 and 19210 levels. The trading range is expected to get wider over the coming weeks.
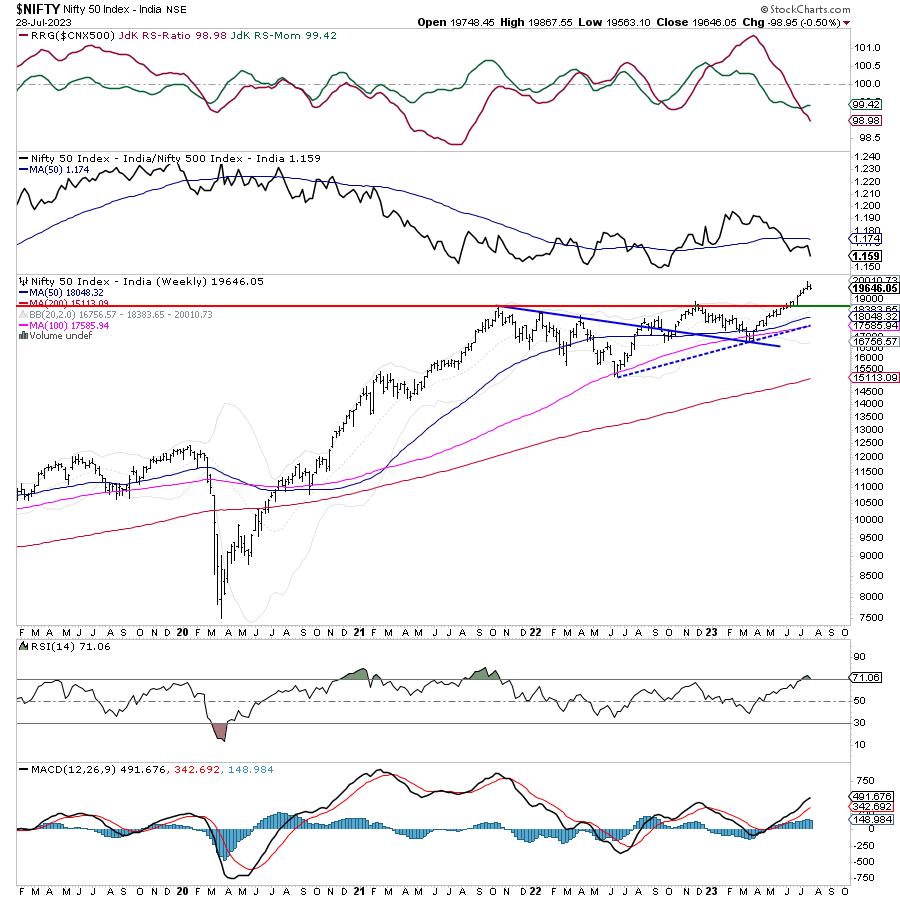
The weekly RSI is 71.06; it remains mildly overbought but still neutral, while not showing any divergence against the price. The weekly MACD is bullish and remains above the signal line.
The pattern analysis of the weekly chart shows that, after achieving a breakout above 18900 levels, the markets look a bit overextended on the charts. There is a high possibility that a temporary top might be in place in the form of the 19991 level; there are no signs of any major drawdown as yet, but the markets may find themselves under a measured consolidation, which can take the shape of a secondary trend. Following a breakout, the support for NIFTY has shifted higher to 18900-19000 levels.
From a very short-term perspective, the derivatives data show mild support for NIFTY at 19500 levels; if this is violated, then the major support zone of 18900-19000 will come into focus. That being said, the creation of a temporary top at 19991 is also likely to infuse some caution into the markets. Given such a low value of VIX, one can also expect spikes of volatility to resurface in the markets. There is a chance that the fabric of the markets may become a bit defensive. It is strongly recommended that one now get highly selective and stock-specific while approaching the markets.
It is also suggested that all up moves should now be used more for protecting profits at current and higher levels, while fresh purchases should be kept limited to low-beta stocks and defensive pockets. While keeping the overall leveraged exposures at modest levels, a cautious outlook is advised for the coming week.
Sector Analysis for the Coming Week
In our look at Relative Rotation Graphs®, we compared various sectors against CNX500 (NIFTY 500 Index), which represents over 95% of the free float market cap of all the stocks listed.

The analysis of Relative Rotation Graphs (RRG) shows that NIFTY Auto, Midcap 100, Consumption, and Realty Indices are inside the leading quadrant. The NIFTY Pharma Index has also rolled inside the leading quadrant and is expected to relatively outperform the broader markets, along with Realty and Midcap Index. The Auto index is seen giving up on its relative momentum.
The FMCG index continues to be inside the weakening quadrant. The Nifty Infrastructure and the PSE Index are also inside the weakening quadrant, but are seen improving on their relative momentum against the broader markets.
The Services Sector Index, Nifty Financial Services, and BankNifty continue to languish inside the lagging quadrant and are set to relatively underperform the broader markets. Nifty Commodities and IT also remain inside the lagging quadrant.
While staying inside the improving quadrant, NIFTY Energy Index is seen improving its relative momentum. The Nifty Media and Metal indices are also seen firmly placed inside the improving quadrant.
Important Note: RRG™ charts show the relative strength and momentum of a group of stocks. In the above Chart, they show relative performance against NIFTY500 Index (Broader Markets) and should not be used directly as buy or sell signals.
Milan Vaishnav, CMT, MSTA
Consulting Technical Analyst
www.EquityResearch.asia | www.ChartWizard.ae