So far in 2022, we've seen elevated volatility, yet another test of the 50-day moving average for the S&P 500, and renewed strength in cyclical sectors over growth. If you were looking for a nice break after the uncertainty of 2021, I'm sure you are quite disappointed at this point!
At the end of the day, all of the competing themes and narratives aggregate into the charts of the major market averages. Or, as one of my mentors used to say, "There is a lot of information embedded in the chart of the S&P 500."
Let's check out the daily S&P chart and see how a technical concept called "polarity" tells us which levels could be most important to watch in the coming weeks.
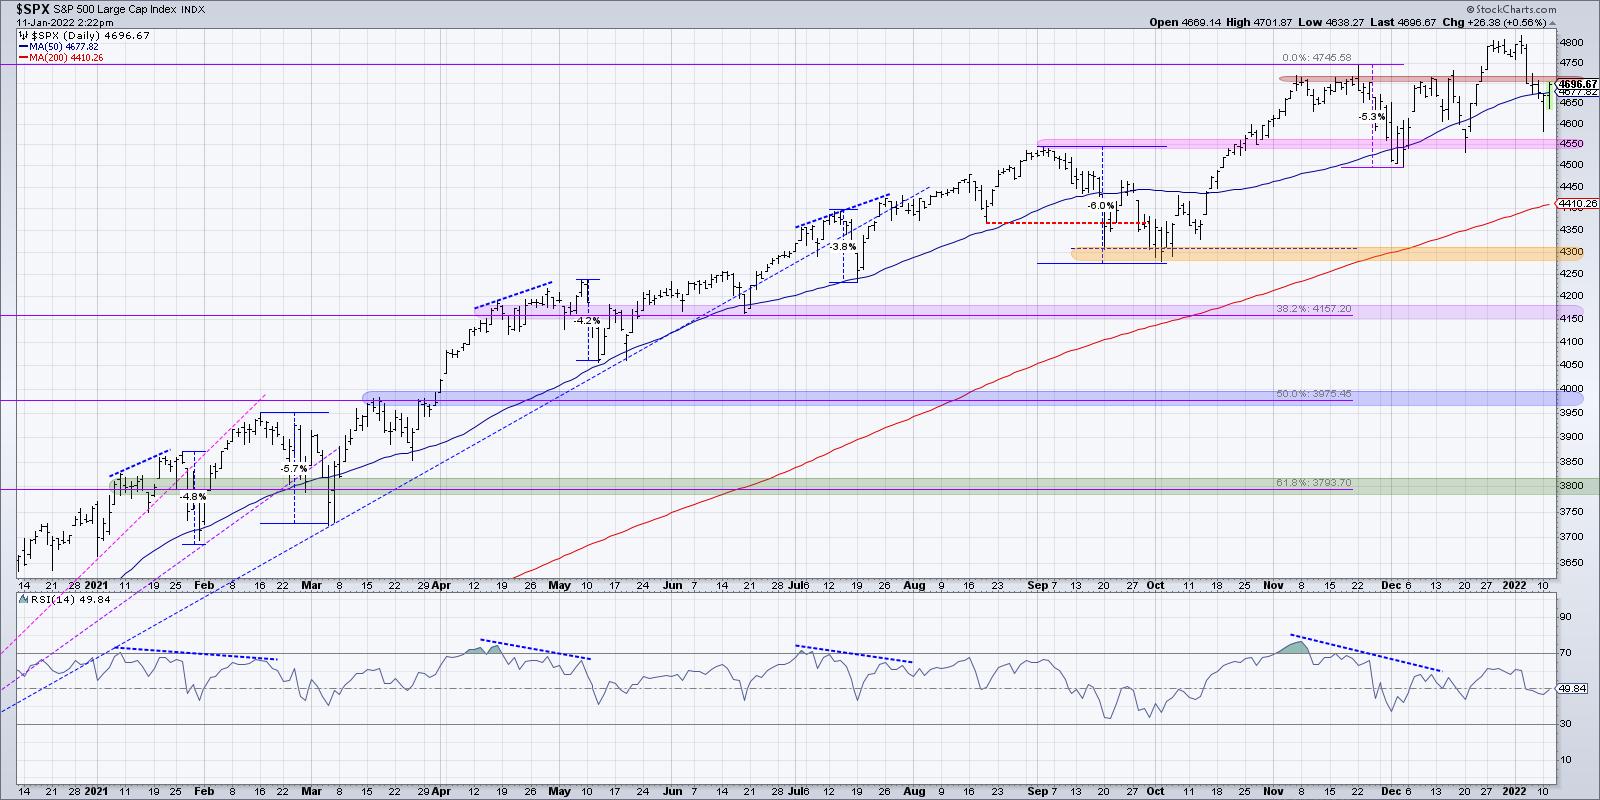
Starting back in September, we see the rise in the S&P 500 value to reach a peak around 4550. Soon after, we saw the deepest drawdown of 2021, which was only about 6% of the high.
In October, the S&P pushed again to new all-time highs, eventually reaching 4700 in early November. This served as resistance for about six weeks before the benchmark finally popped higher to reach its most recent all-time high, around 4800. Draw a horizontal line (shown as a pink shaded area on this chart) from the September high and you'll see how the pullbacks in early December bounced right off this area of support.
This concept of resistance becoming support is called "polarity", which is a generally accepted phenomenon in the technical analysis community. The market has memory, as it's been said, and key price levels tend to become significant and remain meaningful for any price chart. As long as the S&P 500 remains above this key support level of 4550, the medium-term bullish thesis should remain intact. If and when that level is broken, and a previously established support level no longer holds, then investors should reevaluate the new price action and focus more on risk management.
You'll see this concept of polarity around the 4700 level as well. The S&P first hit 4700 in early November, then retested that resistance level 3-5 more times before an eventual break in mid-December. A failure to hold 4700 in the first week of January indicated short-term weakness, and now the S&P is once again testing its 50-day moving average.
So now, we have three key levels to watch as we navigate early 2022.
- We are currently testing the 50-day moving average, which served as key support (and indicated a very buyable dip) through much of 2021. As long as the 50-day holds, the long-term uptrend appears stable.
- If we do break the 50-day moving average, S&P 4550 is the most important level to watch. The technical concept of polarity tells us that resistance often becomes support, and that level has lined up with recent pullbacks in December. A break of that 4550 level would indicate a higher probability of a much deeper corrective move.
- 4800 is now the most important resistance level to watch. If and when the S&P is able to make another new all-time high, then the long-term bullish thesis will be once again confirmed. I'll be very focused on the RSI if this occurs, in order to monitor for a potential bearish momentum divergence.
Want to digest this article in video format? Head over to my YouTube channel!
RR#6,
Dave
P.S. Ready to upgrade your investment process? Check out my free course on behavioral investing!
David Keller, CMT
Chief Market Strategist
StockCharts.com
Disclaimer: This blog is for educational purposes only and should not be construed as financial advice. The ideas and strategies should never be used without first assessing your own personal and financial situation, or without consulting a financial professional.
The author does not have a position in mentioned securities at the time of publication. Any opinions expressed herein are solely those of the author, and do not in any way represent the views or opinions of any other person or entity.