It is super difficult to disconnect from the emotional impact of investing. I've often spoken of the dangers of endowment bias, where we tend to hold on to a losing position despite very clear evidence that we should cut our losses. As legendary technical analyst Ralph Acampora told me early on in my career, "Analyzing the chart is the easy part. Actually doing what the chart says? That's the tough part."
Being a mindful investor is about three things:
- Having a consistent set of routines
- Improving your market awareness
- Finding calmness as an investor by effectively managing risk
For my Market Misbehavior premium members, we actually devote a whole section of my behavioral investing course on how to overcome behavioral biases by injecting discipline into the investment process.
So how are you supposed to stay "cool as the other side of the pillow" when the markets are melting lower pretty much every week? It starts with a consistent weekly routine. Every Friday, I look at charts like this to assess the overall market conditions:
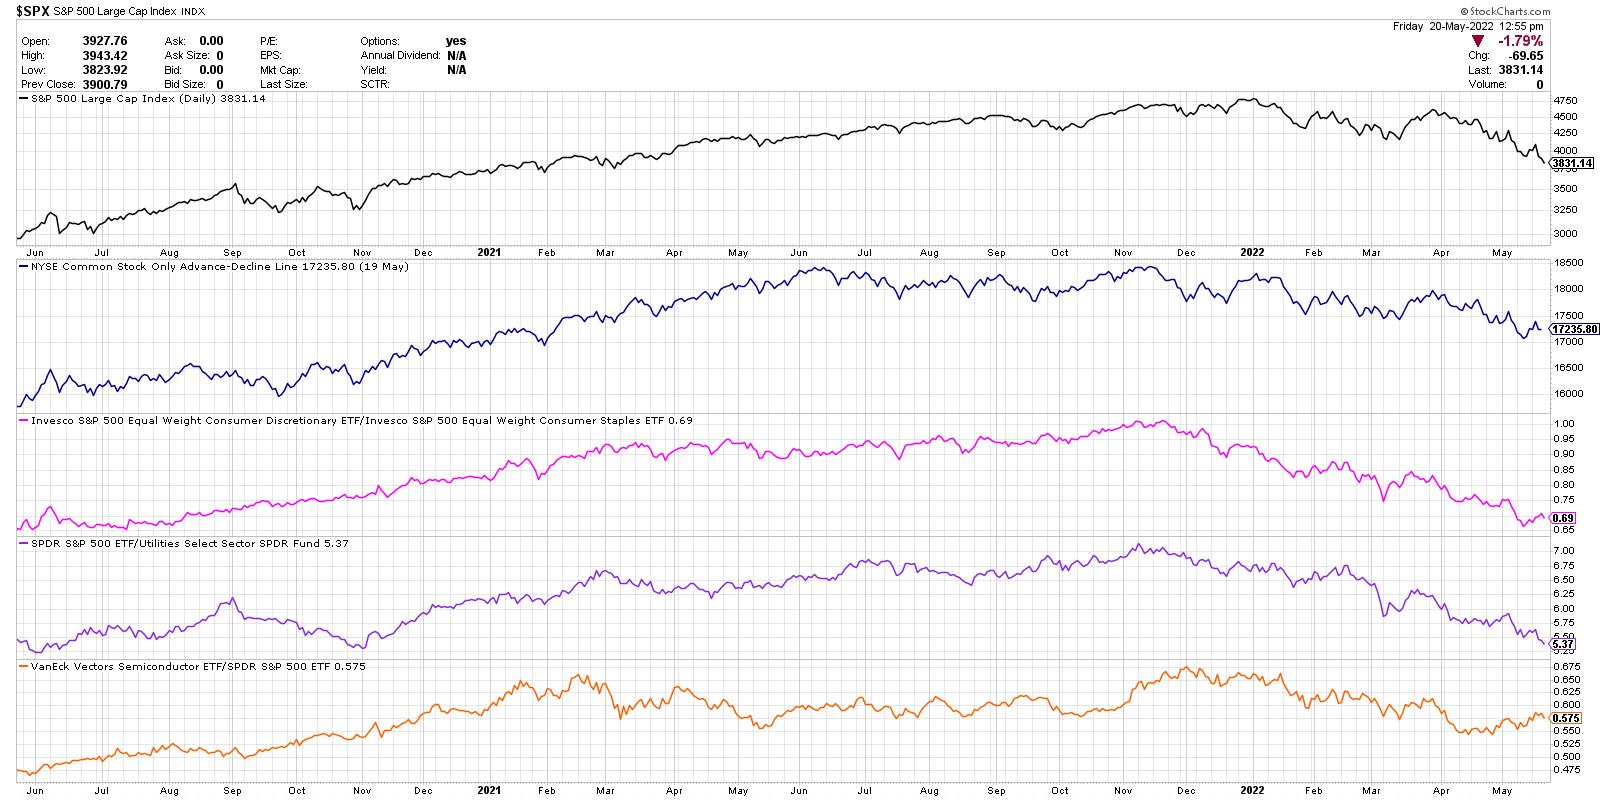
From the top, we're looking at the S&P 500 index on a daily closing basis, the NYSE advance-decline line (common stock only), the ratio of Consumer Discretionary vs. Consumer Staples (equal-weighted), the relative performance of the Utilities sector (inverted) and the relative performance of the semiconductor ETF.
So far in the month of May, four of the five indicators have made a new low for 2022. That means that the S&P 500 is in a confirmed downtrend, the breadth picture is continuing to deteriorate, offense is underperforming defense in the consumer space, and you're better off owning boring Utilities than the S&P 500.
Not a bullish picture.
The final data series at the bottom is the one that has not made a new low. And that is exactly how a market bottom could indeed emerge. One of these indicators stops confirming the bear market, then another, then another. Eventually the evidence is confirming that a bottom has indeed occurred.
This last piece of the puzzle leads me to look at stocks like AMD. Are they confirming this positive rotation for semiconductors?
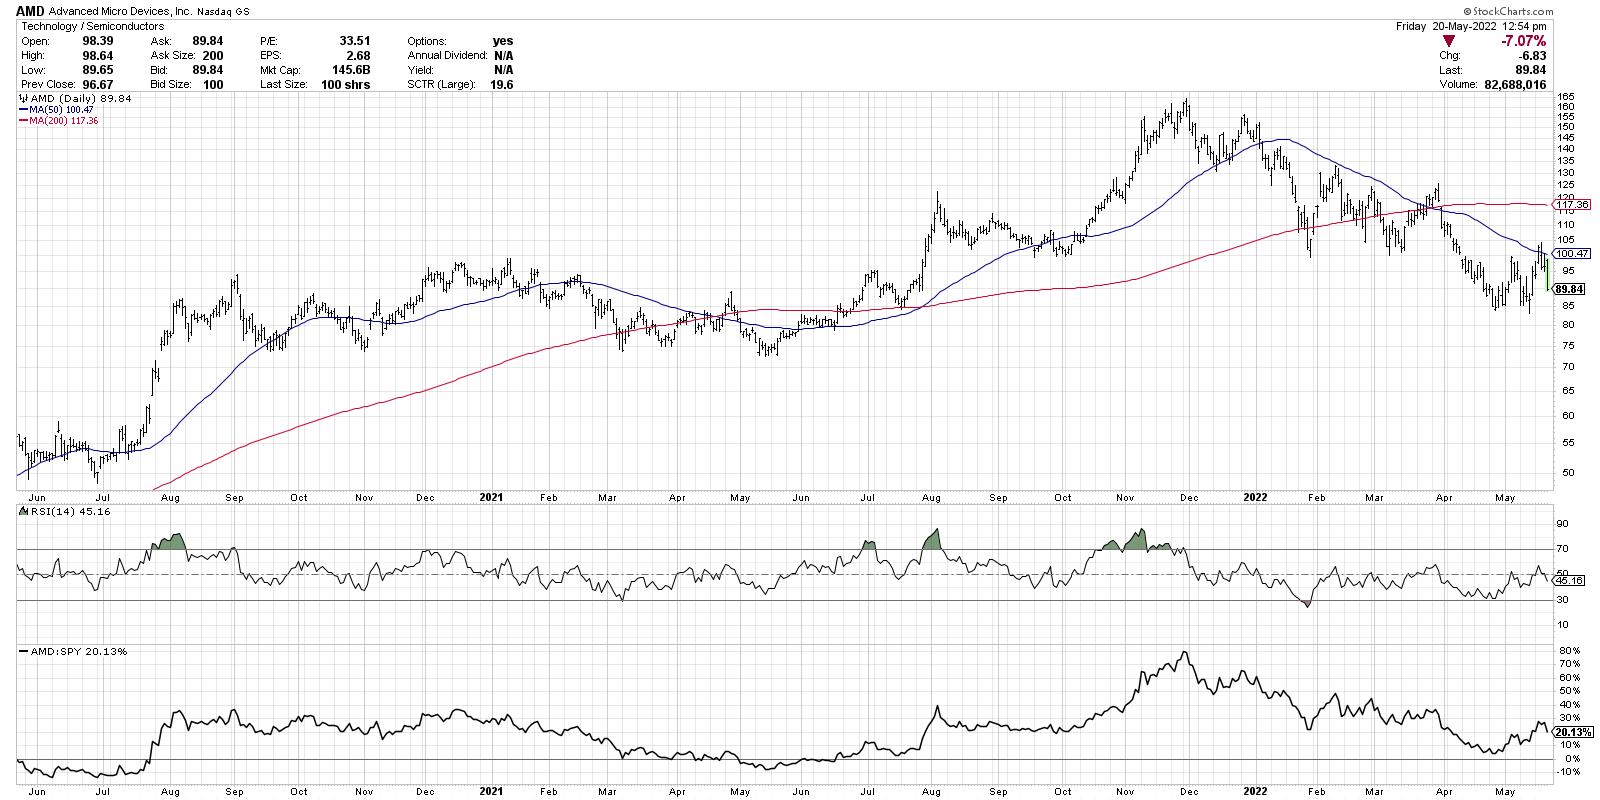
AMD did indeed jump higher this week, but has once again found resistance at the 50-day moving average. So while the relative strength is improving a bit, I'm not seeing enough on the chart of AMD to indicate a bullish rotation.
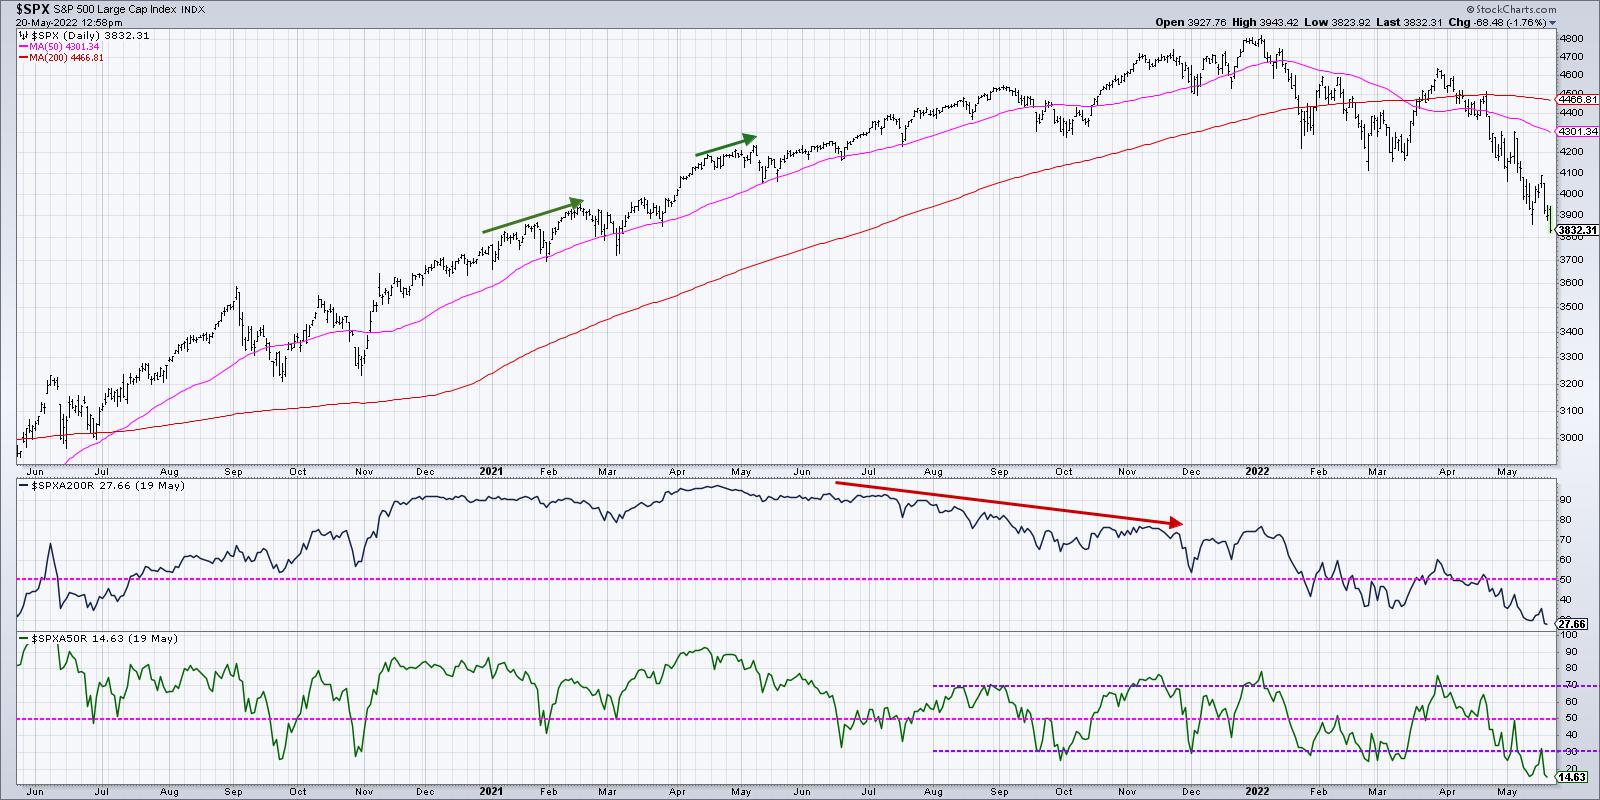
When a market bottoms, charts like AMD break back above the 50-day moving average as buying power comes in to overwhelm the selling pressure in the markets. That causes indicators like the percent of stocks above their 50-day moving average to go well above 30%.
What's the reading as of Thursday's close? Just 15% and making a new low for 2022. See the bottom panel in this chart for the new low this week for this key breadth indicator.
So why am I smiling in the face of a bear market? Because if there's one thing I learned in 2001, 2008 and 2020, it's that worrying about the markets does not seem to help the markets reverse course. My portfolio does better if I focus on managing risk and following trends in any environment. And I'm able to smile because I have a consistent set of routines, a healthy market awareness and a decent risk management strategy.
Want to learn to smile during a bear market phase? It starts with coming to terms with things like endowment bias. For more info, head over to my YouTube channel!
RR#6,
Dave
P.S. Ready to upgrade your investment process? Check out my YouTube channel!
David Keller, CMT
Chief Market Strategist
StockCharts.com
Disclaimer: This blog is for educational purposes only and should not be construed as financial advice. The ideas and strategies should never be used without first assessing your own personal and financial situation, or without consulting a financial professional.
The author does not have a position in mentioned securities at the time of publication. Any opinions expressed herein are solely those of the author, and do not in any way represent the views or opinions of any other person or entity.