Some of my most painful experiences as an investor have come when I have been undisciplined. I would get away from my daily and weekly routines, act rashly when I noticed a compelling chart, and usually end up regretting that decision in a big way. I learned that, by going through the same routine every morning, I would be able to better recognize changes in trend and would in general just increase my overall market awareness.
I knew that my Morning Coffee Routine should begin with a long-term chart of the S&P 500 index. One of my biggest challenges as a long-term investor has been to remain focused on the long-term. If my goal is to do well 1-3 months down the road, I should be less focused on the flickering ticks of short-term market movements and more focused on the long-term trends and how they evolve.
I started with a weekly S&P 500 chart, simply showing the weekly open-high-low-close (OHLC) for the last five years, along with some basic momentum indicators. Nothing special. Over time, I found that, every day, I would look at that first chart and try to answer three questions:
- What is the long-term trend (over one year)?
- What is the medium-term trend (one to three months)?
- What is the short-term or tactical trend (a couple days to a couple weeks)?
I quickly settled on a Market Trend Model that was based on weekly exponential moving averages. I experimented with the moving averages and found that I could define those three time frames using different combinations.
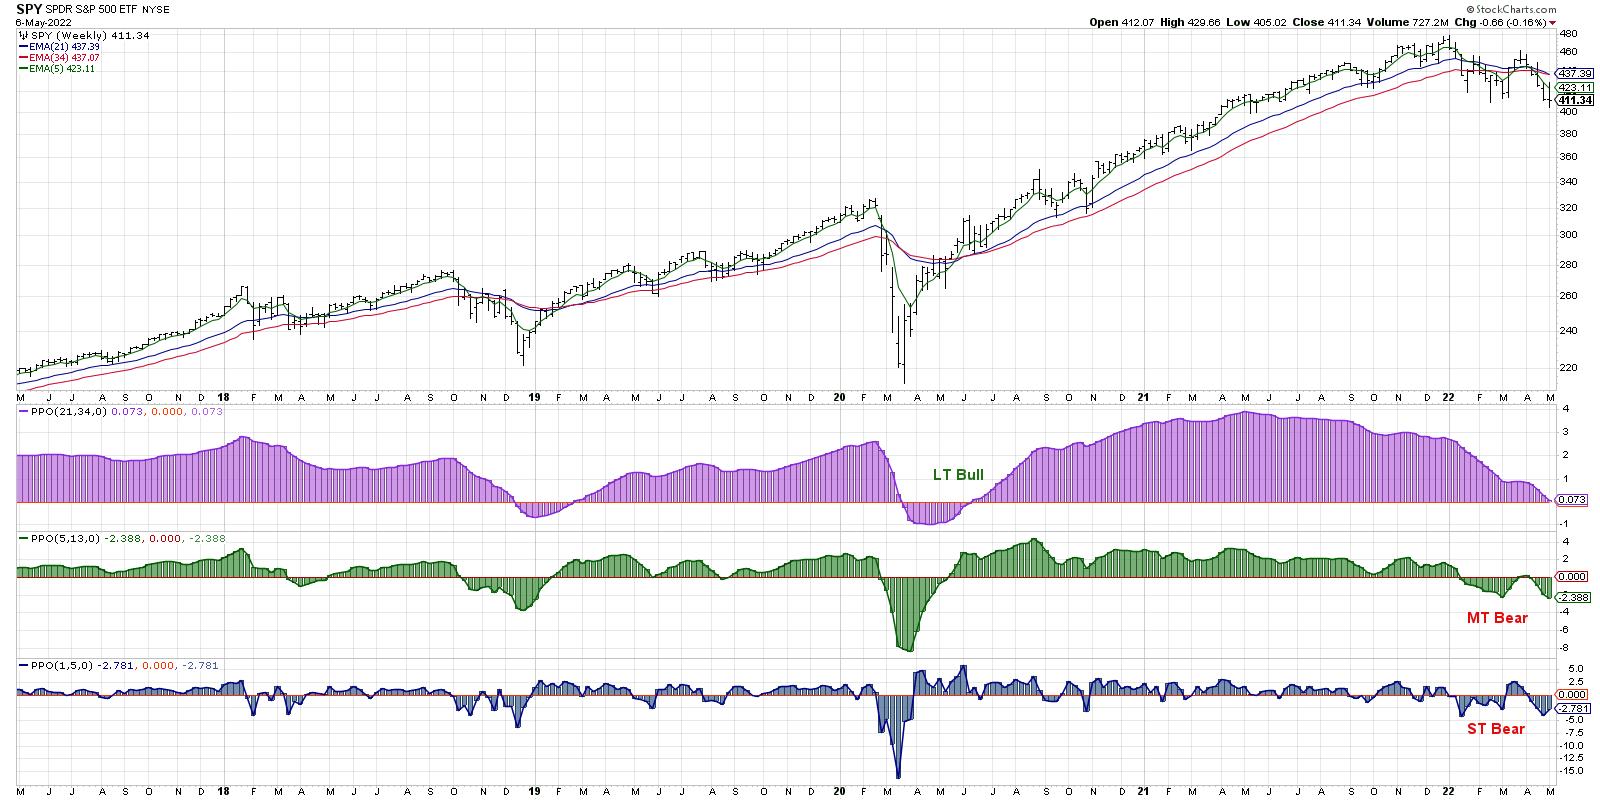
For the long-term trend, I ended up using the 21- and 34-week exponential moving averages. Every Friday, I'd simply compare the two moving averages and determine the trend. 21-week MA > 34-week MA? Bullish. 21-week MA < 34-week MA? Bearish.
I found other combinations that worked well for the other two time frames as well. For the medium-term, it's the 5 and 13-week MA, and the short-term is just the current price versus the 5-week MA. Simple.
This one chart has helped me to remain patient, as a short-term trend occasionally reverses, yet the medium-term and long-term remained unchanged. It has reminded me that there is no one time frame on which all market participants actually participate. Most importantly, it has helped me keep my focus on the time frame in which I'm most interested.
My Morning Coffee Routine goes from there into the daily S&P 500 chart, followed by other major US equity indices and global stocks as well. Then, it's on to other asset classes like commodities and currencies, then finally into US sectors, styles and themes.
At the end of that whole process, I'm then clear to check the current market conditions, as well as my own portfolios. I've first evaluated the market environment and improved my market awareness, before I'm then able to make a proper assessment on current positions and potential trades.
Where do many novice investors go wrong? They have the right steps but in a very wrong order. If you start your day looking at live market update, or tuning into financial television, or checking your current positions, you are priming yourself to make rash decisions based on short-term data.
I was taught to make short-term decisions with short-term data and long-term decisions using long-term data. By beginning the morning with a view of the long-term trends, I'm anchoring my thinking to the long-term. And I will better appreciate how today's short-term movements relate to the long-term trends under which they operate.
Mindful investors recognize that it's not just about having the right inputs into your investment process, but it's also about the order operations. Go macro to micro, big to small, long-term to short-term. The most important chart of the day is the one you start with. Make it a good one!
Want to digest this article in video format? Just head over to my YouTube channel!
RR#6,
Dave
P.S. Ready to upgrade your investment process? Check out my YouTube channel!
David Keller, CMT
Chief Market Strategist
StockCharts.com
Disclaimer: This blog is for educational purposes only and should not be construed as financial advice. The ideas and strategies should never be used without first assessing your own personal and financial situation, or without consulting a financial professional.
The author does not have a position in mentioned securities at the time of publication. Any opinions expressed herein are solely those of the author, and do not in any way represent the views or opinions of any other person or entity.