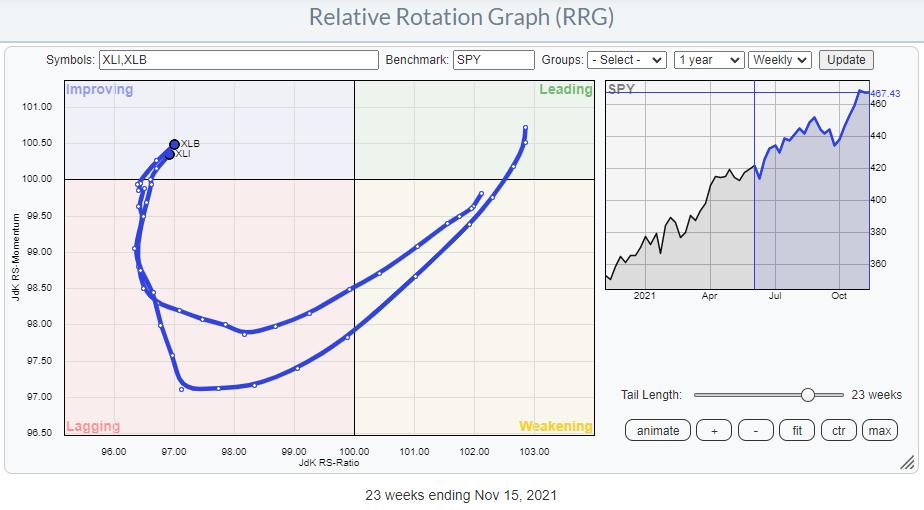
Two sectors that have my attention at the moment are Industrials (XLI) and Materials (XLB).
Looking at the Relative Rotation Graph above, we can see how similar the rotation for both sectors has been over the last 23 weeks, and still is. A few weeks ago, both tails rotated back into the improving quadrant at a strong RRG-Heading.
Materials

The Materials sector broke above overhead resistance on the price chart last week and is holding up well so far this week. This break occurs after a sideways period of roughly six months and, very likely, signals the continuation of the prior uptrend out of the March 2021 low. Based on the height of the range, roughly 10 points, we can estimate a target for the coming move around 97 for XLB.
The relative strength line, which started to drop from the high in March, has stabilized and seems to be putting in a low at the moment. This bottoming process is causing the RRG-Lines to improve and move higher. For the time being, only the Green JdK RS-Momentum line has managed to get back above the 100-level, but the Red JdK RS-Ratio line is starting to come along.
A further improvement is very likely when the raw RS-Line manages to take out the red-dashed overhead resistance. This looks to be in line with the continuing improvement of Cyclical sectors to which Materials belong.
Industrials

The chart of the Industrials sector has a lot of similarities with the Materials sector. A nice uptrend emerged out of the March low, followed by a break of trendline support, then a sideways move of around six months and then an upward break two weeks ago, which is still holding up so far. The accompanying rotation on the RRG is very similar, and at the moment, both tails are more or less on top of each other.
The Industrials sector is part of the "sensitives" group. Particularly on the daily RRG for this group, we can see the improvement that is currently taking shape.
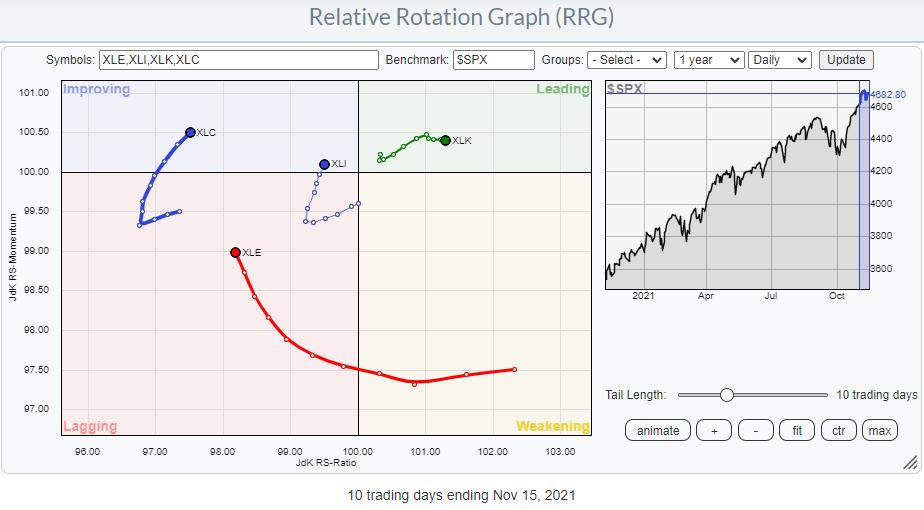
On the weekly RRG, only the Communication Services sector continues to head lower on both axes and deeper into the lagging quadrant. Energy is still pushing further into the leading quadrant and continuing its positive relative trend. Technology is about to turn back up towards leading while only just inside the weakening quadrant.
The weekly tail on the Industrials sector looks very similar to the tail on the daily RRG, which means that both time frames are getting in sync, underscoring the current (relative) strength.
Which Groups?
From the sector level, we can zoom in to the groups level of these sectors.
Materials
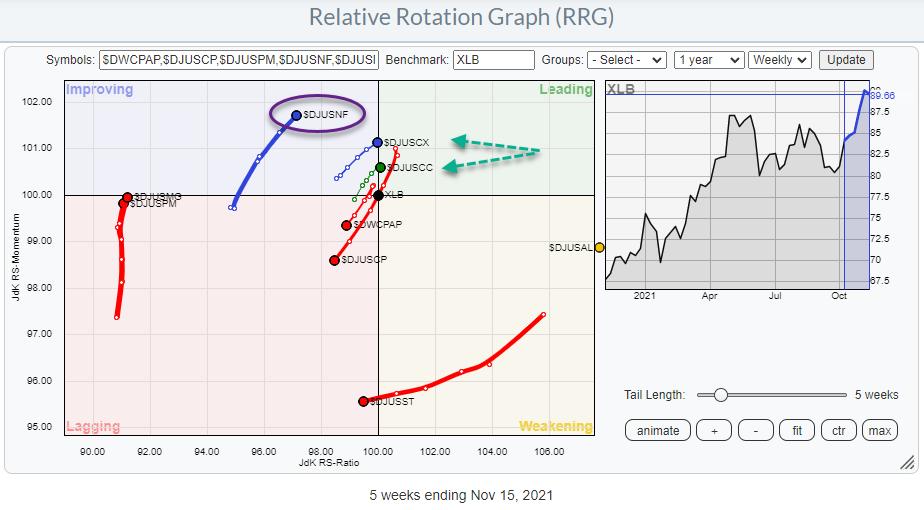
In the materials sector, there are three groups worth taking a closer look at: Specialty Chemicals ($DJUSCX), Commodity Chemicals ($DJUSCC) and Nonferrous Metals ($DJUSNF). Of these three groups, specialty and commodity chemicals are breaking to new highs while their relative strength is bottoming out. This makes them very interesting. The Nonferrous group, meanwhile, is still inside the improving quadrant on the RRG and below its highs on the chart; it is slightly lagging behind the first two.
Industrials

In the Industrials sector, two tails are standing out. These are Industrial Suppliers ($DJUSDS) and Railroads ($DJUSRR). Both are moving further, into the leading quadrant on the RRG and at a strong RRG-heading.
After inspecting the charts for both groups, I prefer the Railroads. The Industrial suppliers have already gone through a steep rise, creating a more significant than desired downside risk.

Railroads have just broken above their previous high and holding up while hovering above that breakout level, which creates a good risk/reward ratio.
Railroads
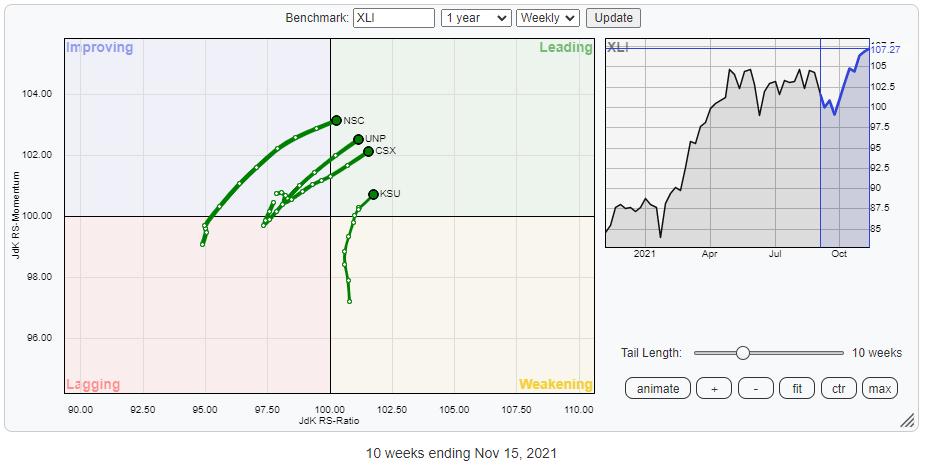
This RRG shows the four Railroad stocks which are in the S&P composite 1500. The direction vs. XLI as the benchmark is pretty straightforward.
CSX and UNP have already broken to new highs, while KSU and NSC are pushing against their previous highs. Assuming further relative improvements, that means that CSX and UNP probably have better risk/reward, as their previous highs can be expected to act as support. KSU and NSC are the more aggressive options, betting on a break above resistance followed by acceleration.
#StaySafe, --Julius
Julius de Kempenaer
Senior Technical Analyst, StockCharts.com
Creator, Relative Rotation Graphs
Founder, RRG Research
Host of: Sector Spotlight
Please find my handles for social media channels under the Bio below.
Feedback, comments or questions are welcome at Juliusdk@stockcharts.com. I cannot promise to respond to each and every message, but I will certainly read them and, where reasonably possible, use the feedback and comments or answer questions.
To discuss RRG with me on S.C.A.N., tag me using the handle Julius_RRG.
RRG, Relative Rotation Graphs, JdK RS-Ratio, and JdK RS-Momentum are registered trademarks of RRG Research.
