RRG Charts August 30, 2022 at 12:10 PM

In this week's edition of StockCharts TV's Sector Spotlight, I look at seasonality and try to align the theoretical expectations for the relative performance of sectors against the S&P 500 going into September with the current reality as it is playing out on the Relative Rotation... Read More
RRG Charts August 26, 2022 at 03:07 PM
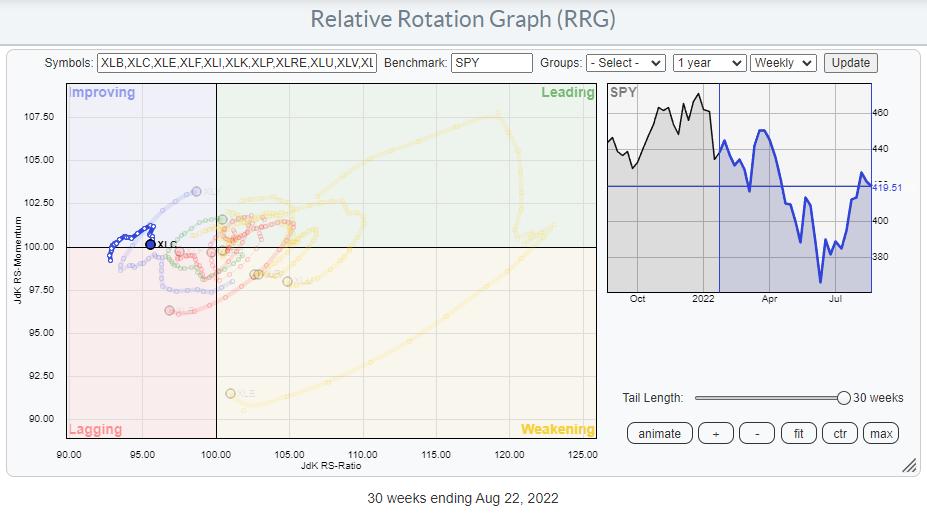
Staying out of a sector can be as important as being in the right sector. This is particularly true for the Communication Services Sector, and has been for a long time already. The Relative Rotation Graph above shows the rotation over the last 30 weeks, starting the week of 1/24... Read More
RRG Charts August 23, 2022 at 01:10 PM
In this week's edition of StockCharts TV's Sector Spotlight, I share my thoughts on potential developments for the S&P 500. First, from an asset allocation perspective, I focus on the development of the USD and interest rates in relation to the stock market... Read More
RRG Charts August 19, 2022 at 04:05 PM

Since my introductory article on the topic, 2018's "Combining Relative Rotation Graphs and the "Turtle Soup" setup", I have mentioned and used this strategy a few times in my articles and analyses... Read More
RRG Charts August 16, 2022 at 12:35 PM
In this week's edition of StockCharts TV's Sector Spotlight, I take a look at recent rotations in asset classes and sectors... Read More
RRG Charts August 11, 2022 at 02:03 PM
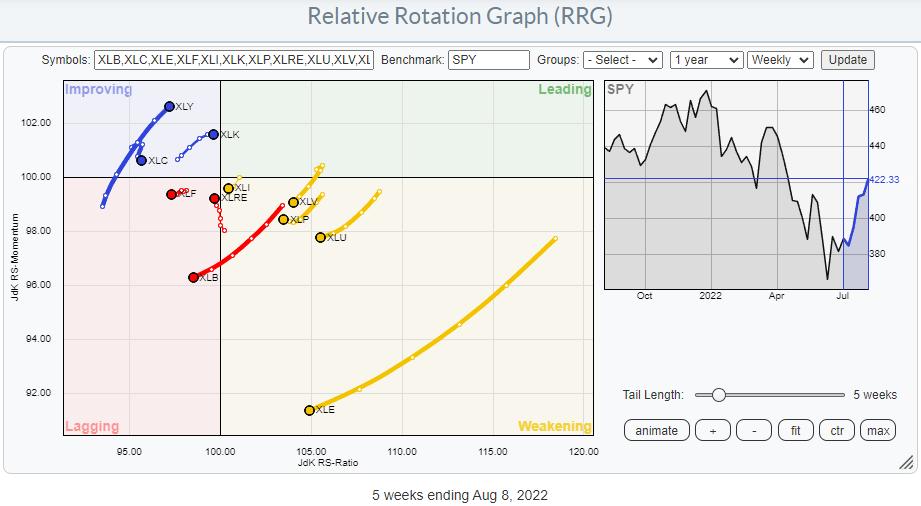
On the Relative Rotation Graph for US sectors, there are only two sectors that are leading the market higher. Not surprisingly, these are growth-related sectors, specifically XLK and XLY, which together make up 40% of the market capitalization of the S&P 500 index... Read More
RRG Charts August 09, 2022 at 01:33 PM
In this week's edition of StockCharts TV's Sector Spotlight, I start with a look at Growth/Value and Size (Large-, Mid-, and Small-Cap) rotations. After that, I take an extensive look at the rotations of Offensive, Defensive and Sensitive sectors and their individual charts... Read More
RRG Charts August 05, 2022 at 03:00 PM
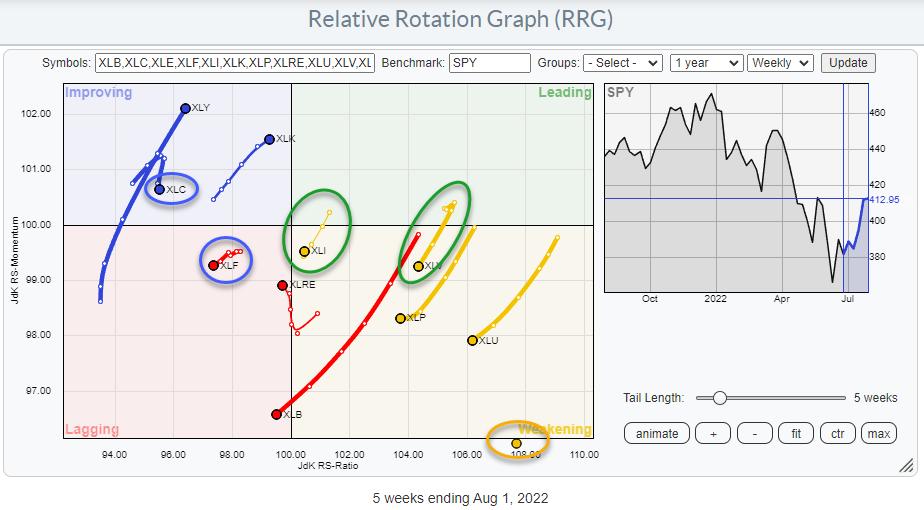
From time to time, I compare the rotations of the SPDR sectors that we usually use with their EW counterparts. The first RRG below shows the rotations for the SPDR sector spiders (cap-weighted). The second RRG shows the rotations of the Equal Weight sectors... Read More
RRG Charts August 02, 2022 at 11:27 AM
In this week's edition of StockCharts TV's Sector Spotlight, I start with a look at the current state of Sector Rotation in US stocks... Read More