TAKEAWAYS
- Not all is what it looks like inside the Consumer Discretionary Sector
- Using Cap-weighted vs. Equal-Weighted Sectors on RRG reveals underlying differences
- Mega-cap Stocks are dragging XLY down
- Using a Simple Scan Leads to four interesting charts
Cap-Weighted vs. Equal-Weighted
Sometimes, you need to look a little further. And concerning the rotations in Consumer Discretionary stocks, this is one of those "sometimes".
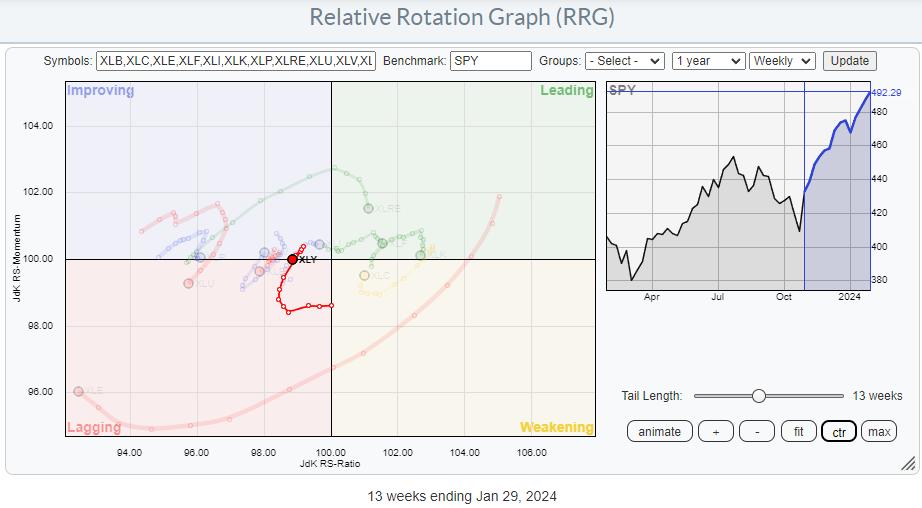
On this Relative Rotation Graph, holding the cap-weighted sectors, XLY is making a nasty turn back down into the lagging quadrant after a brief period inside improving. At first glance, this would lead to the suggestion or conclusion that Consumer Discretionary stocks are rotating out of favor and are setting up for a new down-leg in an already established relative downtrend.
However...
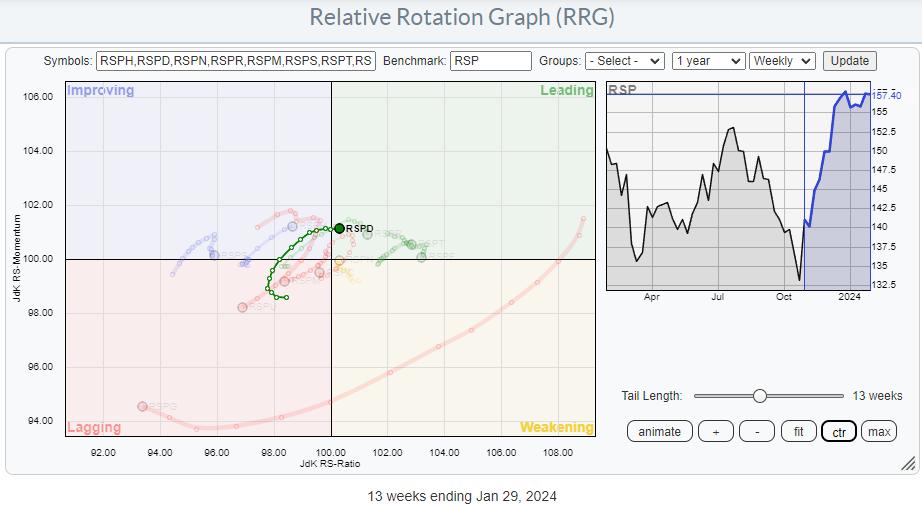
Looking at the RRG that shows the equal weight versions of the S&P sectors the tail on Consumer Discretionary is travelling at a completely different path. It's much more positive.
RSPD just rotated into the leading quadrant after a period through lagging and improving.
From this rotation, the Consumer Discretionary sector looks much healthier than the cap-weighted rotation of XLY.
Mega-Caps Are Dragging XLY Down
The first takeaway from this observation is that the heavy-weight names inside XLY are dragging the cap-weighted sector down. As a result, we can conclude that the second or third-tier stocks in this universe are doing pretty well.
Another way of visualizing this relationship, not only for Consumer Discretionary but for all cap-weighted vs. weighted sectors, is by plotting their rations on a Relative Rotation Graph and using $ONE as the benchmark.
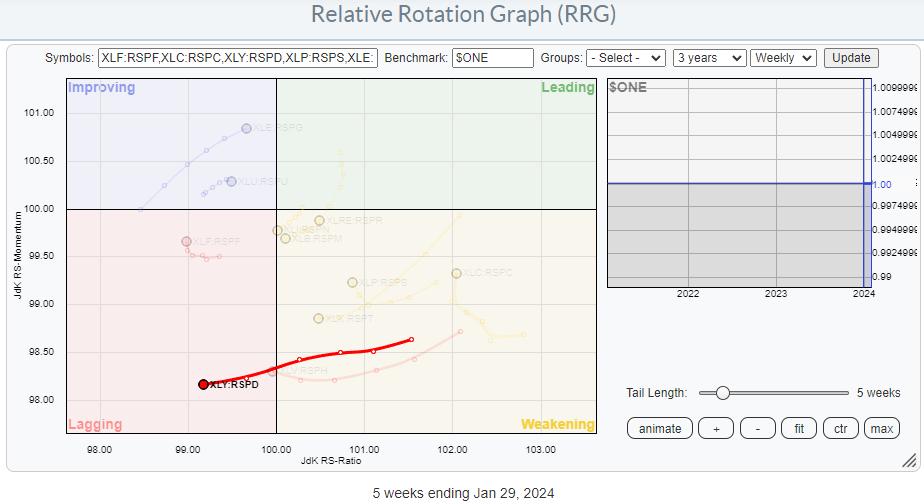
This shows the tail for XLY:RSPD is rapidly moving into the lagging quadrant, confirming that rotation favors non-large/mega-cap stocks in the consumer discretionary sector.
Finally, we can look at the relationship between large- and small-cap Consumer Discretionary similarly.
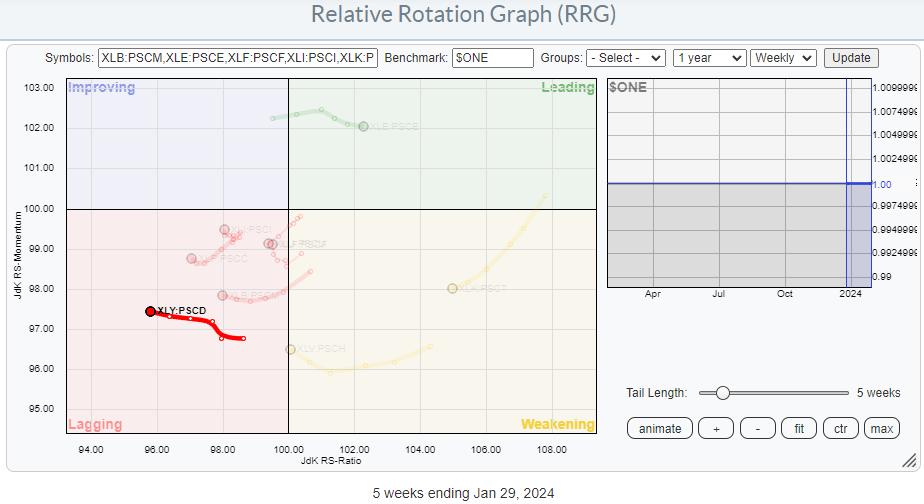
This shows the XLY:PSCD tail also moving deeper into the lagging quadrant.
Looking For Stocks
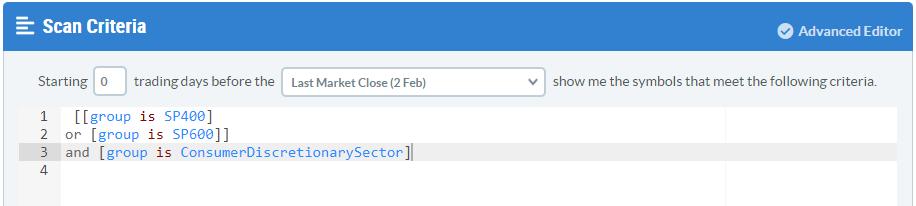
With this knowledge, I want to see if I can find some stocks worth looking at. Therefore, my pool of stocks to go through is stocks that are either in the S&P 400 (MidCap) or S&P 600(SmallCap) AND in the Consumer Discretionary Sector.
I can easily find those by using the advanced scan workbench.
Running this scan returns 172 symbols. So I need to trim this list down a little further. I am going to do that by adding a simple requirement, like the RSI needing to be above 60. That ensures that the price is already moving higher, and I am adding the requirement that the Close must be above its 10-day moving average AND that the RSI must be above 60.
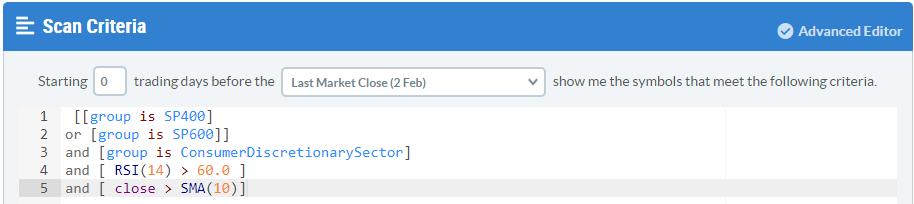
Running this scan results in a list of 33 symbols, which is very manageable.
Plotting Them on a RRG
After saving that list as a ChartList, I can then plot them on a Relative Rotation Graph.
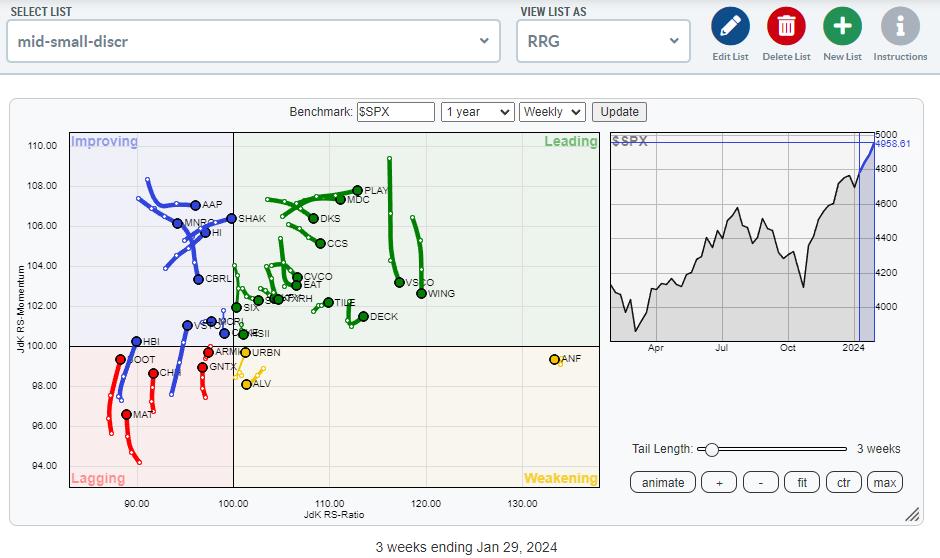
After visually inspecting the rotation of these tails and their price charts, I ended up with four potentially interesting stocks.
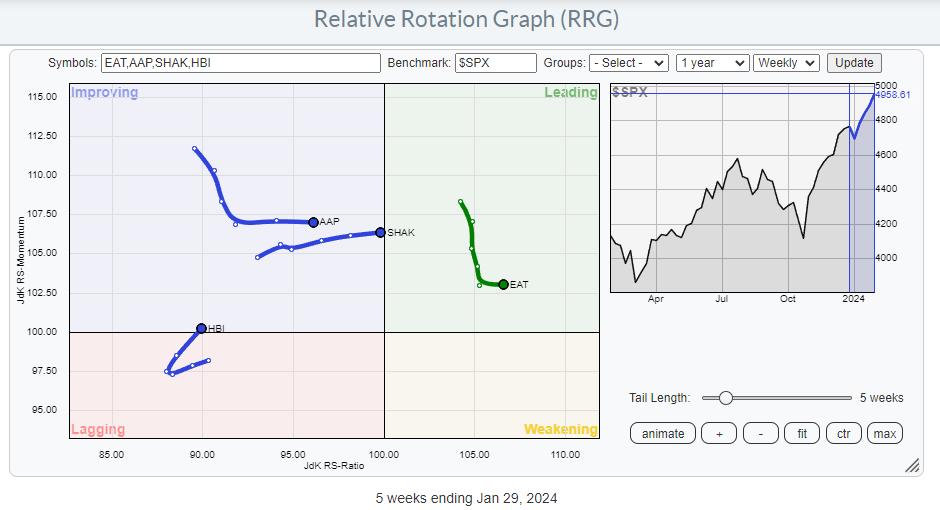
HBI - HanesBrands Inc.
The chart that got my attention is HBI. On the RRG, it is showing a nice rotation back into a positive RRG-Heading and moving into the improving quadrant. Remember that the group as a whole is already showing strength, so HBI is trailing that development, which means that it has the potential to catch up within the sector.
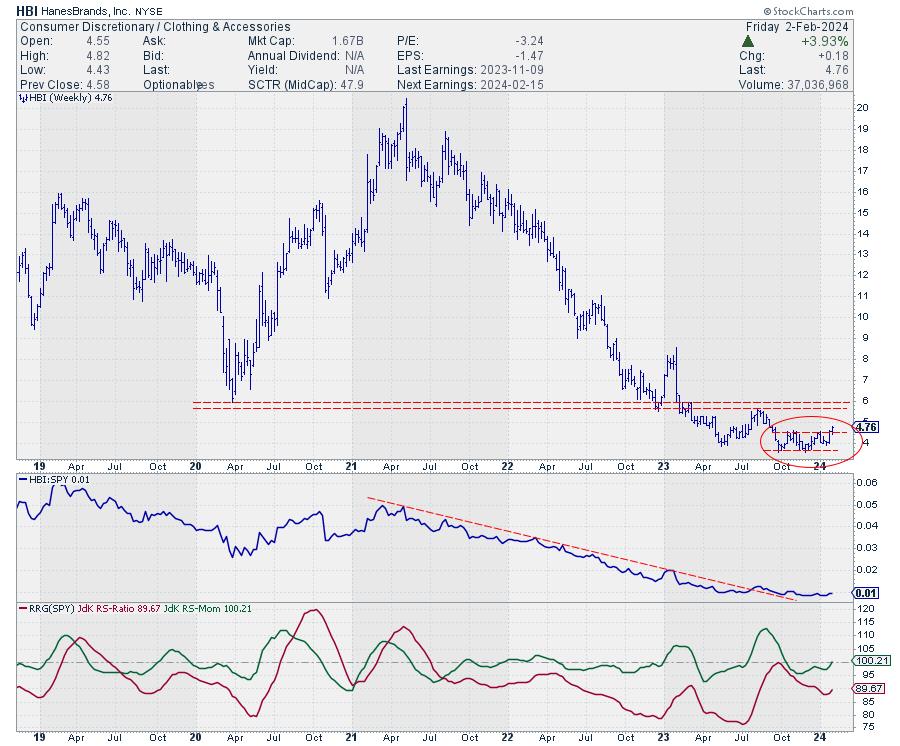
After a long downtrend in which HBI lost around 80% of its value in three years, the stock started to bottom in the second half of 2023, and this week it broke out above the resistance offered by its previous two highs.
This move opens the way for a further rise towards the next resistance area, around 5.5-6.0. That is roughly 20% upside potential, with support only 5-6% below current levels.
#StayAlert and have a great weekend, --Julius
Julius de Kempenaer
Senior Technical Analyst, StockCharts.com
Creator, Relative Rotation Graphs
Founder, RRG Research
Host of: Sector Spotlight
Please find my handles for social media channels under the Bio below.
Feedback, comments or questions are welcome at Juliusdk@stockcharts.com. I cannot promise to respond to each and every message, but I will certainly read them and, where reasonably possible, use the feedback and comments or answer questions.
To discuss RRG with me on S.C.A.N., tag me using the handle Julius_RRG.
RRG, Relative Rotation Graphs, JdK RS-Ratio, and JdK RS-Momentum are registered trademarks of RRG Research.
