RRG Charts April 24, 2024 at 07:20 PM
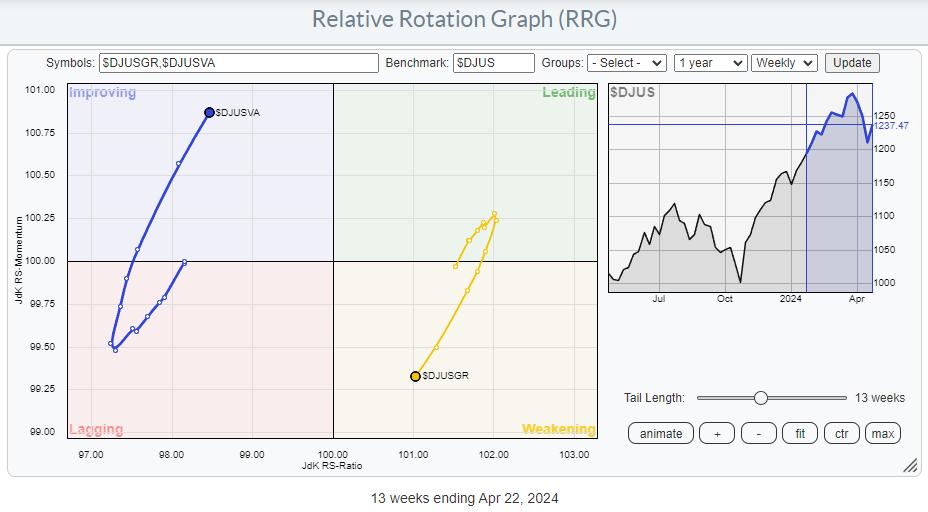
Value Taking the Lead from Growth The weekly RRG above shows the rotation for Growth vs. Value stocks, with the DJ US index as the benchmark. The recent rotation clearly shows the rotation out of growth into value taking shape and picking up steam... Read More
RRG Charts April 11, 2024 at 06:32 PM
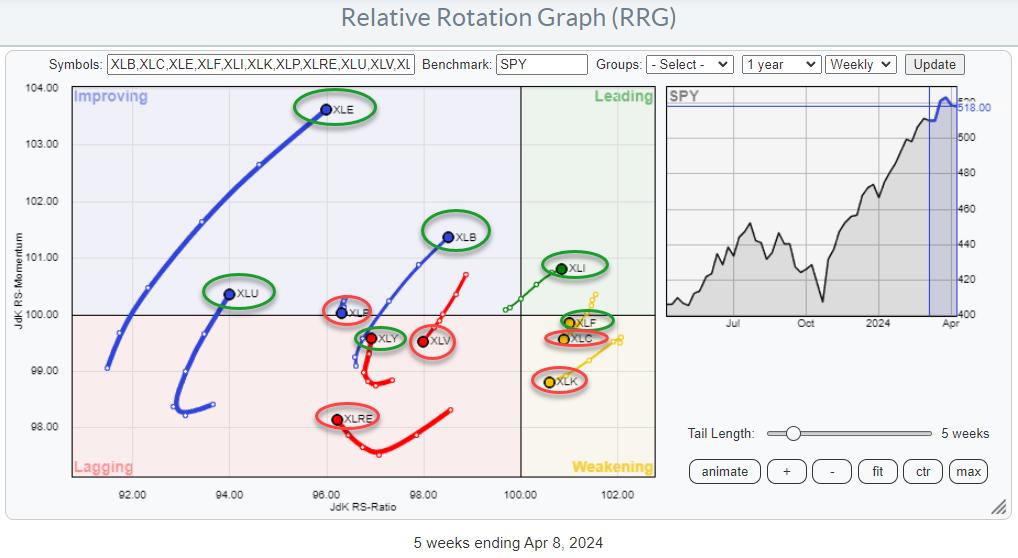
A Sector Rotation Summary A quick assessment of current sector rotation on the weekly Relative Rotation Graph: XLB: Still on a strong trajectory inside the improving quadrant and heading for leading... Read More
RRG Charts April 05, 2024 at 03:21 PM
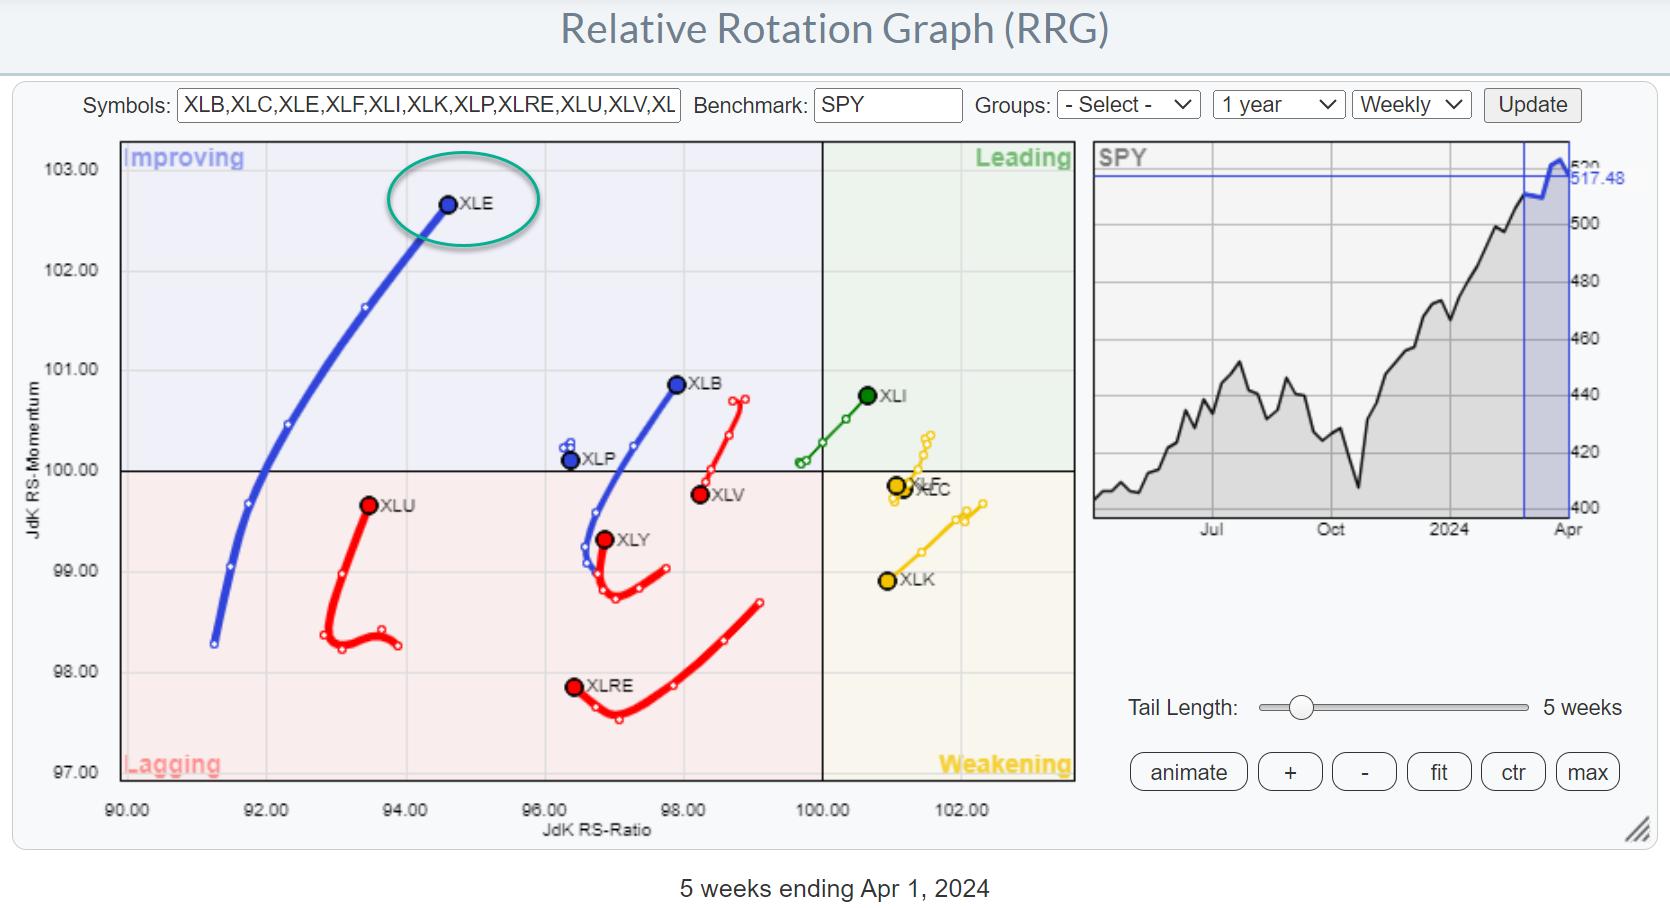
Strong Rotation on the Weekly RRG For a few weeks now, the improvement in the energy sector (XLE) is becoming increasingly visible in the lengthening of the XLE tail on the Relative Rotation Graph... Read More