
In order to make it easier for readers to profitably use our research, I'm going to take some time each week, to explain our indicators measure and how we use them. This week, I'm going to start with Options Sentiment.
People generally view options buyers as usually wrong speculators, and as such, they tend to view Put/Call ratios as contrary indicators. This isn't exactly incorrect, but it doesn't tell the whole story. We certainly use the CBOE, and Equity Put/Call ratios as contrary indicators short-term. In fact, we use the 10-day moving average of those readings as an intermediate-term indicator of market risk. If traders have been buying a lot of call, for instance, over the past two weeks, chances are they (and regular stock buyers) may be too overconfident and thus over-exposed to the market--indicating a risk of a sell off. How much is "a lot" or "too much"? That varies from index to index and over time. Basically we look at the range over the past year and use the upper and lower boundaries as "signal triggers".
Now, some Put/Call ratios are not contrary indicators. The OEX P/C is one of them. For some reason, these index options are dominated by "smart money". This is probably a number of large port folio managers using puts and calls to less the expense of larger selling or buying activity. In any case, we use the OEX P/C similarly to other P/C ratios, except inverse. When folks are buying a lot of OEX Calls, we view the market as likely to go up and when folks are buying a lot of OEX Puts, we view the market as likely to decline.
ISEE is similar to an ordinary Put/Call ratios, except that it is an index, with 100 as neutral and less Bullish, and more than 150 as Bearish. ISEE actually measures opening transactions in puts and calls, and excludes firm and market maker activity. The creators claim this gives a clearer idea of market sentiment and I am inclined to agree. The 10-day ISEE is used to get an intermediate-term feel for the market, with less than 100 as Bullish and more than 135 as Bearish.
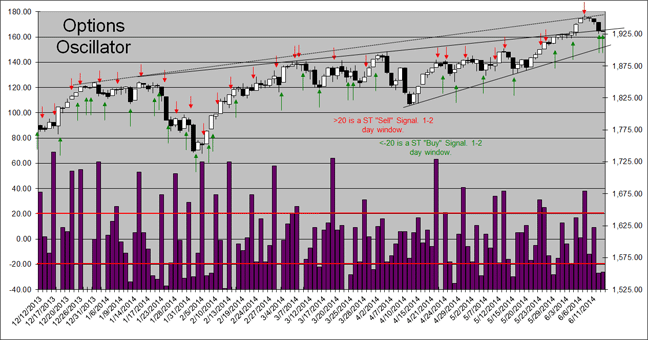
The Options Oscillator is also derived from opening options transactions, and identifies periods of speculative fervor or even uneconomic trading activity (buying or selling to protect a position or meet a margin call). Greater than +20 is Bearish and less than -20 is Bullish.
The VIX is the "Volatility Index" and is derived from the SPX options premiums. A high number suggests high volatility and perceived risk in the market and a low number suggests a stable and more Bullish market. The Relative VIX is a bottom spotter par-excellence. This points out periods where the options premium is so far above the norm that it is extremely likely that the market is sold out, and may represent a compelling target of opportunity for a large and sophisticated premium capture program associated with structural buying. The Daily VIX is simply an overbought/oversold reading on the VIX, suggesting opportunities that programmers may wish to exploit which may create buying and selling opportunities for nimble speculators to exploit.
The CBOE:SPX is the ratio of the S&P500 and the CBOE Put/Call ratio. We then use an exponential moving average on this to smooth the readings. This gives us a read on both the market trend and any shifts in speculative bias. This is not an oscillator.
The Options Buyers Sentiment Gauge (OBSG) applies the principles of momentum and relative strength to the daily average P/C Ratio for Equity and Index option volume. Low readings indicate Bullish extremes and high readings indicate Bearish extremes. More on this indicator here http://www.market-harmonics.com/free-charts/sentiment/obsgdecript.htm
With that out of the way, let's run down the indicator:
Options Sentiment--
Daily CBOE P/C ratio: 0.77. Neutral.
10-day P/C ratio: 0.79. Sell.
Equity P/C ratio: 0.56. Neutral. (the Equity 10-day is Bearish at 0.52)
OEX PC ratio (not a fade): 2.20. Sell.
OEX 10-day PC ratio: 2.98. Sell. Very Bearish.
ISEE Sentiment Index: 93. Neutral.
10-Day ISEE Sentiment Index: 101. Neutral.
Options Oscillator: 17. Neutral.
Relative VIX: Neutral.
Daily VIX: Neutral.
CBOE:SPX: Sell.
OBSG: Neutral.
The options,are still a bit Bearish for the market. The 10-day CBOE and Equity P/C's and the OEX P/C's all still look Bearish for the market. The CBOE:SPX is still negative and confirmed by momentum. The Options Oscillator Buy delivered a little rally. I'm a little bit nervous when speculators are thinking this is a great buying opp, but the smart money OEX traders are buying puts. The Market Harmonics' Options Buyers Sentiment Gauge (thank you, Tony Carrion http://www.market-harmonics.com) is Neutral coming off a Buy.
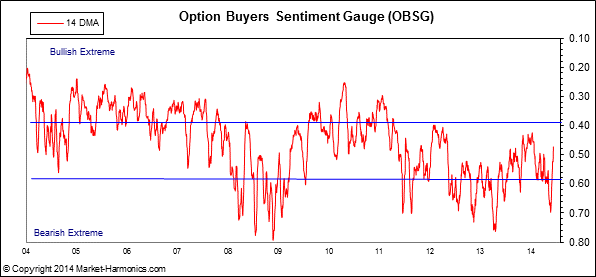
Most options indicators are contrary; if most folks are buying calls, we want to fade them and go short and vice versa. The OEX nominal P/C is an exception, because the OEX traders tend to be right, unless they are paying up for options (which will show up in the $-weighted data). The ISEE Sentiment Index indicator is contrarian; traditionally, over 200 is too optimistic, under 100 is too pessimistic. OBSG provided by Tony Carrion of Market Harmonics.
General Public Polls
Investors Intelligence reported 62.60% Bulls and 17.20% Bears vs. 62.20% Bulls and 17.40% Bears last week. That's virtually unchanged. This is still a solid Sell. We did a short article on the low reading and posted it on Traders-Talk, here: http://www.traders-talk.com/mb2/index.php?showtopic=153035.
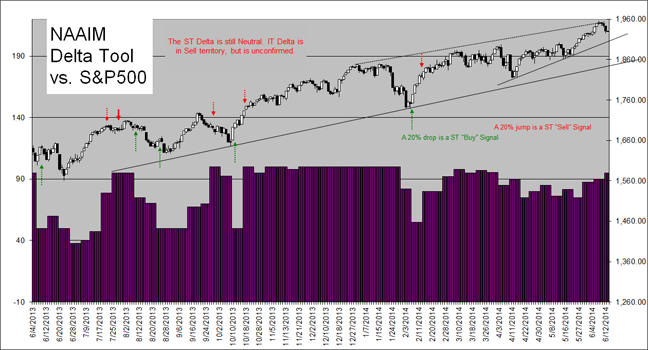
National Association of Active Investment Managers (NAAIM) Sentiment Survey reported that the Median market exposure rose to 95.00% from 90.00%. The mean exposure fell some to 87.30% from 90.86%. The minimum exposure remained at 0% short. The Maximum exposure stayed 200% long. Looks like there was only modest shifting, not enough to alter any quartile. The 95% Reading is a bit overdone. For more on this, see our white paper here, http://www.traders-talk.com/mb2/index.php?showtopic=116382.
AAII is showing 44.69% Bulls and 21.25% Bears. Last week, we had 39.51% Bulls and 22.22%. This is more Bulls and a few less Bears. This is a Sell. Timely!
Lazlo Birinyi's site, Tickersense reported 50.00% Bulls and 29.18% Bears vs. 32.00% Bulls and 40.00% Bears. That's a minor Bearish shift and that looks modestly Bullish to me. This is our least predictive survey.
The Newsletter Advisors were even more Bullish at at 70.60% (Long) vs. 61.7% (Long). This is rather overdone. The Naz advisors got more Bullish at 75.00% (Long) vs. 43.80% (Long). This is also getting too Bullish, too fast. This may bring some selling almost immediately this week.
TSP Talk came in (Thursday evening) with 56% Bulls and 33% Bears. This looks to be slightly Bearish for the market. They had 52% Bulls and 32% Bears last week.
Citigroup Panic/Euphoria Model is on a Sell.
http://online.barrons.com/media/marketSentiment.gif
Conclusion (from Thursday Evening)
Last time, I said that worried about how the options are showing dumb money as being overly confident about the market while the smart money traders were buying puts. This morning, we had a FL/FS Buy, and like the Options Oscillator, the signal had some time to get right. I was looking for weakness today and maybe a rally tomorrow. Despite the repeat Options Oscillator Buy, I'm a little less confident. We may have to take a hard shot down to get the speculators to give up on buying this dip. The smart money guys are telling us that they at least have one more bout of selling in them. very easily. The 10-day options P/C's are all Bearish, suggesting that a more serious correction may be coming soon. None of our contemplated confirming indicators have confirmed our "Secret Hedge Fund" trading model Sell.
Mark Young
Editor
WallStreetSentiment.com
859-393-3335