
Monitoring purposes SPX: Sold on 10/5/15 at 1987.05; gain 2.28%. long SPX on 9/22/15 at 1942.74.
Monitoring purposes GOLD: Flat
Long Term Trend monitor purposes: Flat
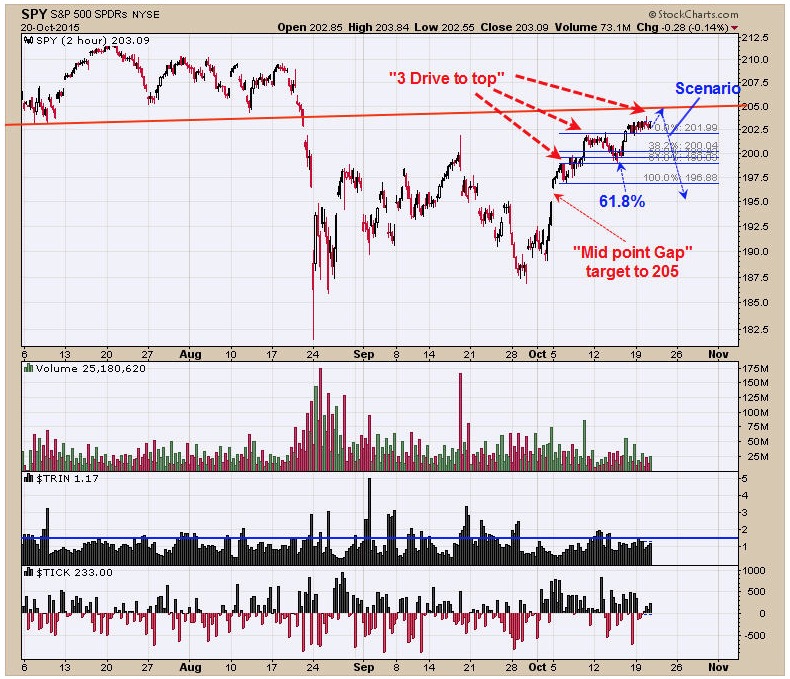
The chart above is the two hour chart of the SPY. On October 5 a “Mid point Gap” formed that gave an upside target to 205 on the SPY which is also where a Neckline of the Head and Shoulders top and a resistance zone. On the two hour chart one can make out the possibility of a “Three Drives to Top” forming. The key element for a “Three Drives to Top” pattern is for the retracement off the second top needs to be at least a 61.8% retracement of the previous rally and this one does that. It appears SPY is working on the “third top” and ideally one would like to see a push to the strong resistance near 205 Neckline resistance and “Mid point Gap” target. There is a possibility a sell signal could get triggered near the 205 level on the SPY.
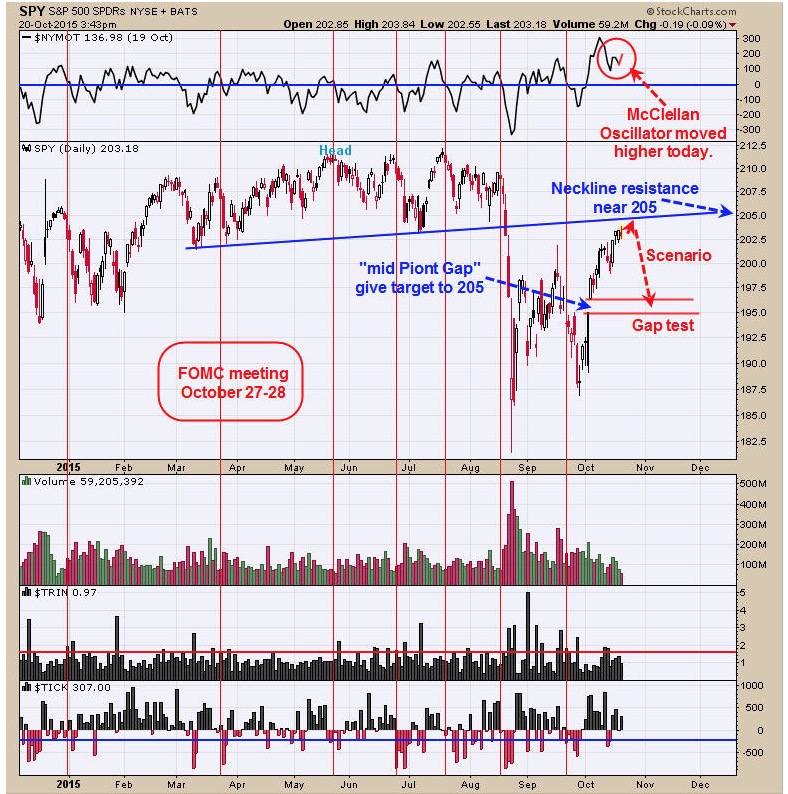
The “Head” of a “Head and Shoulders top” formed in late May and the “Neckline” was broken in August and confirmed the “Head and Shoulders top”. The market is attempting to rally back to the Neckline line resistance which comes in near 205. The October 5 gap also gives a target to 205. When two or more indicators give a target to the same number than the odds increase that number will be seen. The top window is the McClellan Oscillator and readings above “0” are considered bullish. Yesterday’s reading came in at +137 and today’s close came in at +148 and showed the market got stronger today even though market backed off today. This condition suggests market may hold up another few days. The FOMC meeting is October 27 – 28 (Next Tuesday and Wednesday) and market may tread water until then. If a sell signal does get triggered our downside target will be near the gap level of 195. Still neutral for now. Sold long SPX on 10/5/15 at 1987.05 = gain of 2.28%; Long SPX on the close of 9/22/15 at 1942.74.
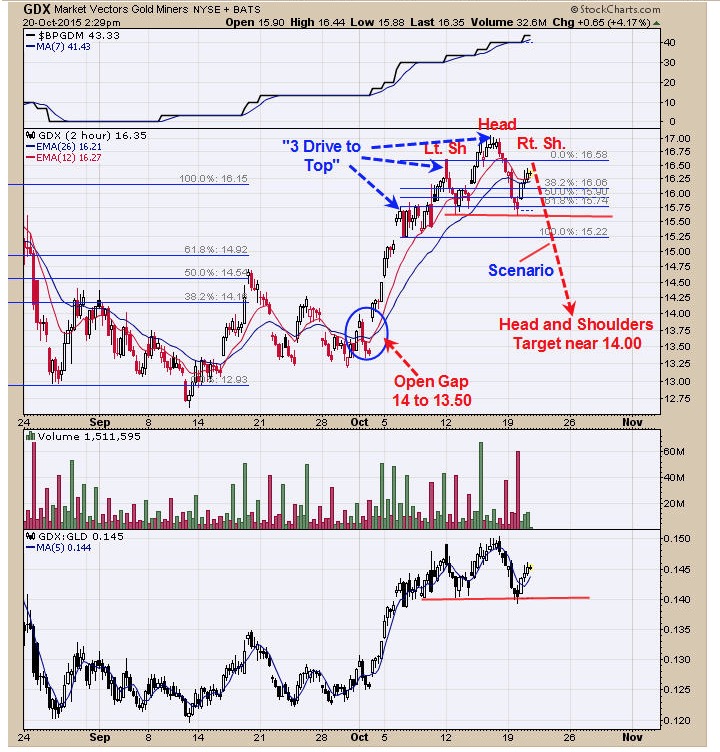
On last Thursday report, we said, “Today GDX broke to a minor new high and the GDX/GLD ratio continues its negative divergence and suggests a pull back is coming. GDX new short term high today produced a volume that dropped in half from yesterday’s volume. This conditions shows the market is exhausted to the upside and do for a pull back. The potential Head and Shoulders bottom pattern appears still in play. We have a minor cycle low due 10/19 and support in the 15 to 14 range and which would represent the Right Shoulder low for the potential developing Head and Shoulders bottom on GDX. This developing Head and Shoulders bottom has a measured target near 19.50.” The GDX chart above is on the two hour timeframe. It appears a “Three Drive to Top” was completed on October 16 which has a minimum downside target to 15.25. Also there appears to be a small “Head and Shoulders top” developing that has a measured target to 14.00 range which is also where an open gap lies from October 2. If the small “Head and Shoulders top” pattern plays out than a bullish signal could develop near 14.00. On a bigger scale, next low should form the bottom of a larger Right Shoulder of the Head and Shoulders bottom pattern where the September 11 low was the Head that we have been talking about which has an upside target near 19.50. This bullish setup could be triggered this week.
Tim Ord,
Editor
For examples in how "Ord-Volume" works, visit www.ord-oracle.com. New Book release "The Secret Science of Price and Volume" by Timothy Ord, buy on www.Amazon.com.