
Monitoring purposes SPX: Neutral.
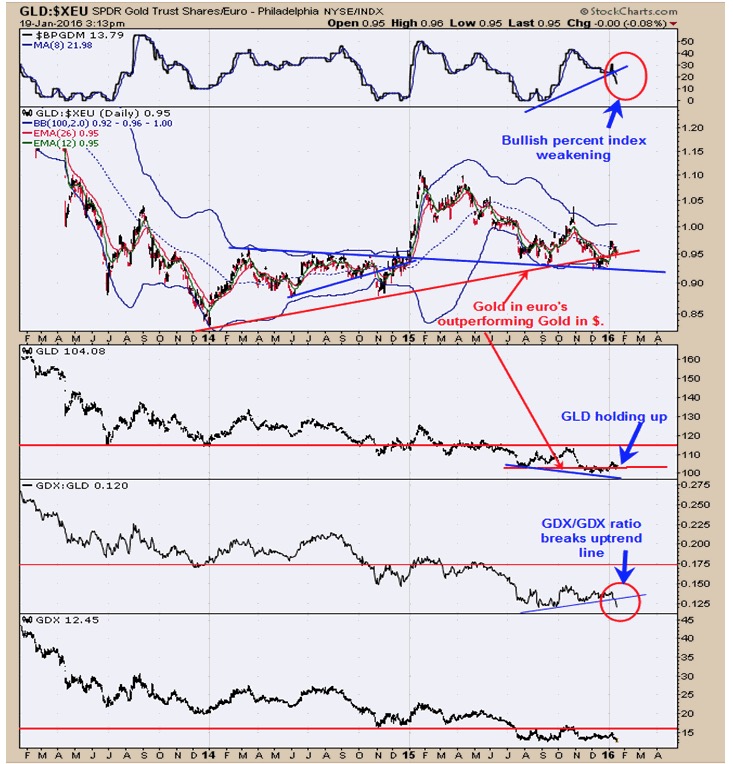
Monitoring purposes GOLD: Sold GDX 1/19/16 at 12.45: Long GDX on 11/20/15 at 13.38.
Long Term Trend monitor purposes: Short SPX on 1/13/16 at 1890.28
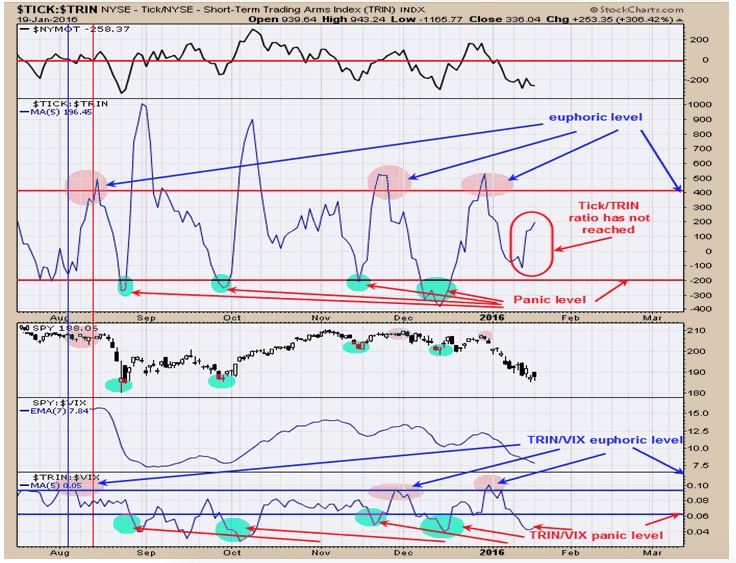
As we have said before, panic is what market bottoms are made of. We measure panic using the tick, trin and VIX. The bottom window is the TRIN/VIX ratio. Readings above .10 are considered euphoric and readings below .06 show panic and the current reading is .05. Window above the SPY chart is the Tick/TRIN ratio. Readings above 400 show euphoric and readings below -200 show panic and the current reading is +196.45. Most bottoms form when both the TRIN/VIX and Tick/TRIN ratios reach into panic levels. The TRIN/VIX ratio has but the Tick/TRIN ratio never did and therefore a bullish short term signal has not been triggered. There is still a possibility a bullish signal will be triggered if and when the Tick/Trin ratio reaches bullish levels. Long term short SPX on 1/13/16 at 1890.62 and short term neutral. Respond for 30 day free trial to the Ord Oracle.
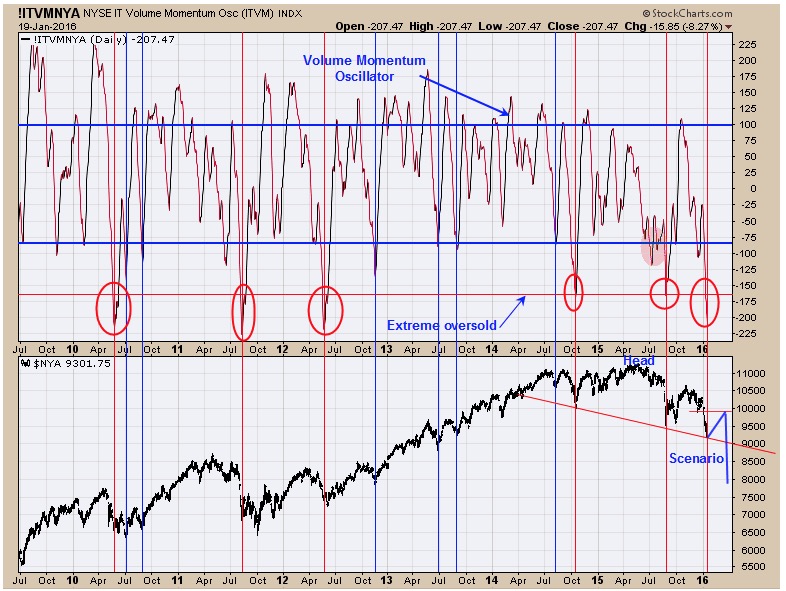
Above is the Volume Momentum Oscillator. The red circled areas represent when the Volume Momentum Oscillator reaches extreme oversold level which we are currently in. This chart goes back 6 ½ years and previous instances when Volume Momentum Oscillator reached into this level the market was near a low. As we mentioned on page one of this report the Tick/Trin ratio has not reached the bullish level for a short term bullish setup, but with the Volume Momentum Oscillator at extremes the Tick/TRIN ratio produce panic readings soon. If and when a short term signal is triggered, the NYA should find stiff resistance near 10,000 and possibly turn back down from there.
The Gold Commercials came in at -43,585 as of 1/12/16; previous week -19,275, big jump in shorts. Commercial COT readings below 50K short are bullish for gold. When gold stocks are out performing gold than that condition is bullish for both gold stocks and gold and that happens when the GDX/GLD ratio is rising. Over the last several days the GDX/GLD ratio turned down and a bearish sign for short term. The second window down from the top is the chart of Gold in Euro’s. Gold in Euro’s is outperforming gold in Dollars and in the past gold in Euro’s have lead the way for gold and a bullish sign for gold in Dollars. The top window is the Bullish percent index for the Gold Miners. The last few days show that the bullish Percent index has been falling and another short term bearish sign. The eight year cycle for Gold bottoms around April 2016 and can arrive early or late several months and we are in that bullish window now. We closed out our GDX position today as there are short term divergences. Sold GDX 1/19/16 at 12.45. Long GDX on 11/20/15 at 13.38.
Tim Ord,
Editor
For examples in how "Ord-Volume" works, visit www.ord-oracle.com.
New Book release "The Secret Science of Price and Volume" by Timothy Ord, buy on www.Amazon.com.