
Monitoring purposes SPX: Neutral.
Monitoring purposes GOLD: Sold GDX 1/19/16 at 12.45: Long GDX on 11/20/15 at 13.38.
Long Term Trend monitor purposes: Short SPX on 1/13/16 at 1890.28
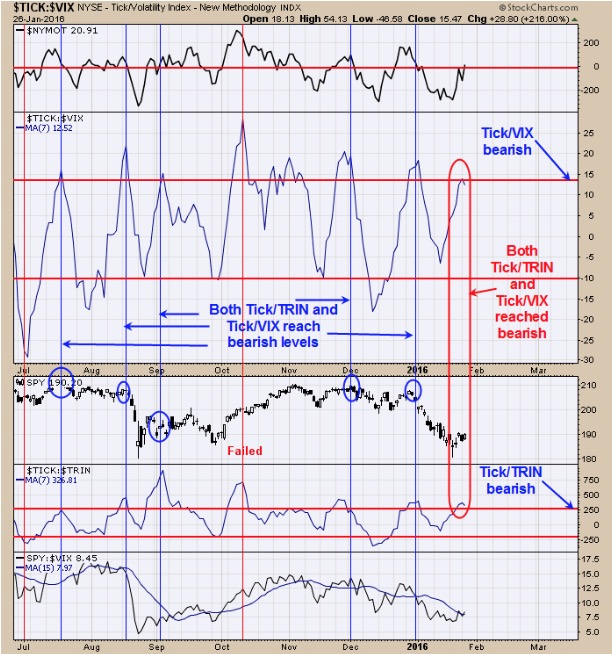
Today and tomorrow is the FOMC meeting which may put short term volatility in the market. Yesterday there was a minor extreme in the TRIN and Ticks readings suggesting a possible short term bounce. Well today’s bounce produce bearish readings in the Tick/VIX ratio and the Tick/TRIN ratio suggests the short term bounce may not go far. We have said on past reports that a sideways consolidation may be in play rather in a worthwhile retracement of the previous decline and with the bearish readings on our ratios today’s there appears limited upside from here. We will remain neutral for the short term. Long term short SPX on 1/13/16 at 1890.62 and short term neutral.
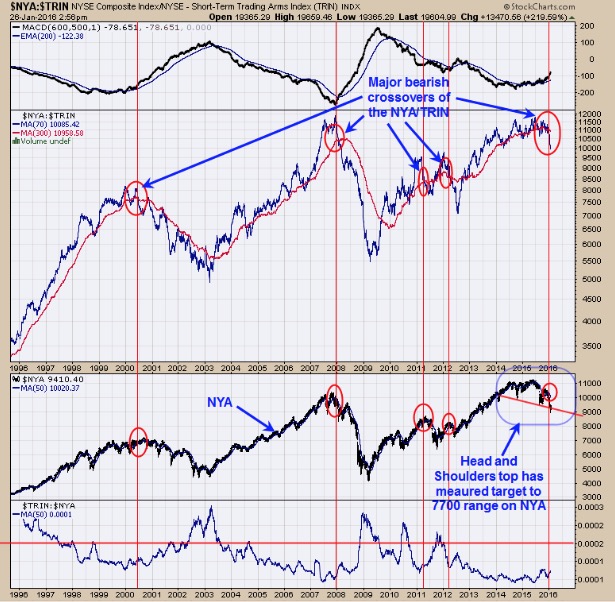
Above is a longer term view of the NYA going back to 1996. The NYA/TRIN ratio show the major bearish crossovers circled in red. There have been five major sell signal triggered by this method going back 20 years and the previous four worked out well. On a previous report we showed the SPY/TRIN ratio (which also has given a sell signal) but the NYA/TRIN ratio has a much bigger universe of stocks and therefore a better indication of what the whole stock market is doing. The two previous sell signals of 2011 and 2012 just lasted a short time but the two signals before that lasted over a year (does than mean the current and next sell signal will be year or longer?). The pattern forming on NYA appears to be a Head and Shoulders top which has a measured downside target to 7700 range. A bullish signal will be triggered when the NYA/TRIN ratio has a bullish crossover.
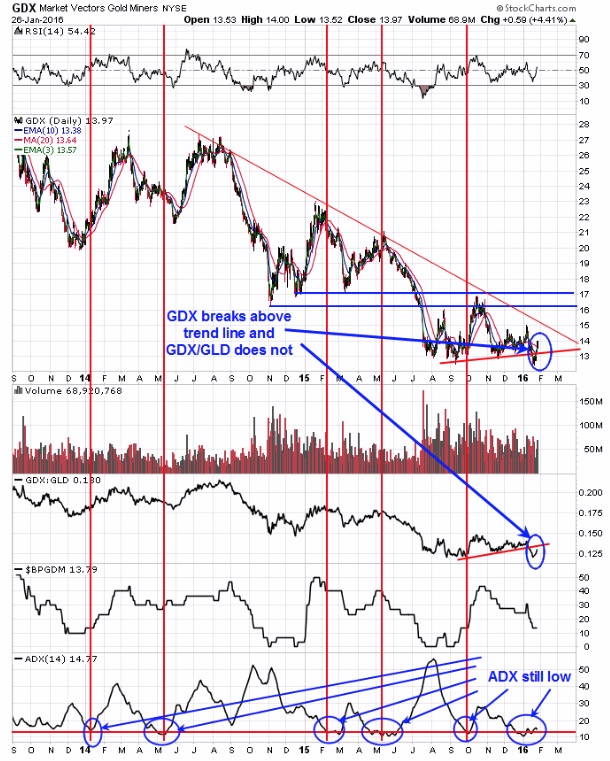
The Gold Commercials came in at -40,143 as of 1/20/16; previous week -43,585. Commercial COT readings below 50K short are bullish for gold. Today’s push back above the Neckline suggests yesterday’s pattern was not a Head and Shoulders top. The third window up from the bottom is the GDX/GLD ratio. In bullish cases for gold and Gold stocks, this ratio rises showing gold stocks are outperforming gold. Notice that the GDX/GLD ratio has not broke back above its red trend line where GDX has; showing Gold is outperforming GDX (gold stocks). We would like to have seen the reverse of this condition for the bullish case. The bottom window is the ADX (average directional index). ADX has been staying low since mid December and it looked like at one point it was breaking out to the upside in early January but failed. Short term pictured for GDX still remains mixed.
Tim Ord,
Editor
For examples in how "Ord-Volume" works, visit www.ord-oracle.com. New Book release "The Secret Science of Price and Volume" by Timothy Ord, buy on www.Amazon.com.